Como acompanhar KPIs (Indicadores e metas) em uma X-matrix
Tradução automática do inglês. Exibindo o original em inglês.
The fourth list of the matrix holds your KPIs – by default called Targets to Improve. Each KPI gets its own tile in the section below the matrix, so you see the whole story of the year.

What a tile shows
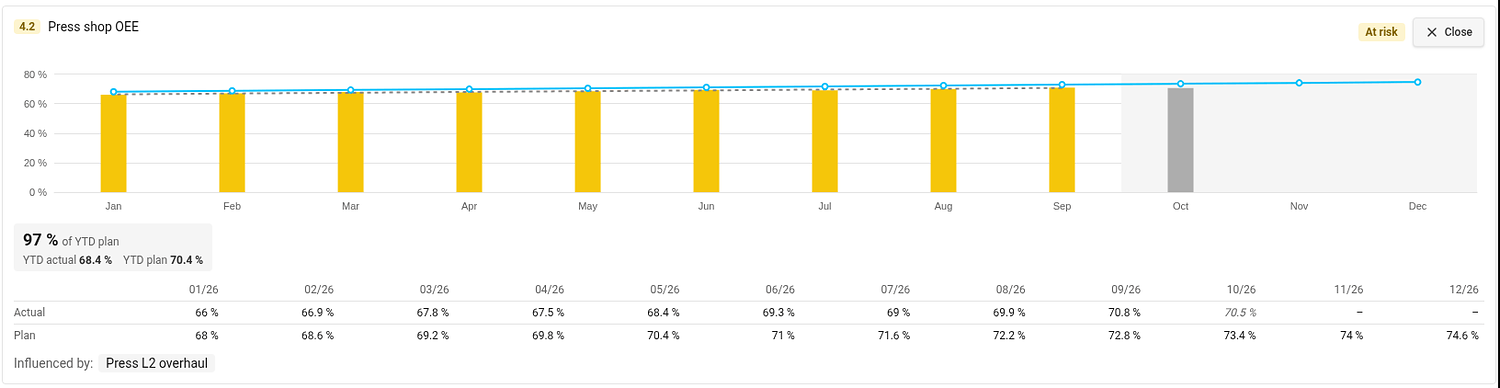
- Bars – the actual value of each month. The color of a bar is the status of that month, taken from the color coding of the metric. A gray bar is the month in progress: it is not rated, because its value may still be incomplete.
- Blue line – the monthly plan. The rest of the year is shaded.
- YTD box – the share of the year-to-date plan met (for example 97 % of YTD plan) with the YTD actual and YTD plan it compares.
- Status in the top right corner. Hover over it to see how it was calculated.
Values are shown in the unit of the metric on the plan’s main metric dashboard, and the unit is printed next to the numbers and on the axis.
Open the detail
Click the magnifier on a tile. The tile opens across the page with a taller chart, a gray dashed trend line, a table of the monthly actual and plan values and the projects that influence the KPI (Influenced by). Open on the metric dashboard takes you to the metric. Close (or Esc) folds the tile back.
Connect a KPI to a metric
A KPI shows values once it has both a metric and a metric object. Until then its tile shows a dashed placeholder.
- In the section Targets to Improve click Edit (or click Connect metric / Select metric object directly in the placeholder).
- In the Metric column choose the metric and the object it is measured on.
- Click Done.
The metric needs a monthly plan for the plan year. KPI metrics are also added to the main metric dashboard of the plan (see Settings → Main metric dashboard), if you may edit that dashboard.
Interval and Period at the top of the edit list set how the trend graph of the KPI opens. They are one setting for all KPIs of the plan.
KPIs measured on a project
If the metric object of a KPI is a project you may edit, the tile offers Add to project metrics. It adds the metric to the project’s metric viewer and turns on the project metrics section of the project. If the project already shows it, TeamGuru tells you and changes nothing.
Which year do the KPIs show?
The plan year. By default it is the current fiscal year; you can review another one in the plan settings (see How to change the settings of an X-matrix). The year-to-date values run up to the last closed month.
A quarta lista da matriz contém os KPIs – por padrão chamada Indicadores e metas. Cada KPI ganha um bloco próprio na seção abaixo da matriz, para você ver a história completa do ano.
O que um bloco mostra
- Barras – o valor real de cada mês. A cor da barra é o status daquele mês, de acordo com o código de cores da métrica. Uma barra cinza é o mês em andamento: ela não é avaliada, porque o valor ainda pode estar incompleto.
- Linha azul – o plano mensal. O restante do ano fica sombreado.
- Caixa acumulado no ano – quanto do plano acumulado no ano foi atingido (por exemplo, 97 % do plano acumulado), com o real acumulado e o planejado acumulado comparados.
- Status no canto superior direito. Passe o mouse sobre ele para ver como foi calculado.
Os valores aparecem na unidade da métrica no dashboard de KPI principal do plano, e a unidade é exibida ao lado dos números e no eixo.
Abra o detalhe
Clique na lupa de um bloco. O bloco se abre na largura da página, com um gráfico mais alto, uma linha de tendência cinza tracejada, uma tabela com os valores mensais real e planejado e os projetos que influenciam o KPI (Influenciado por). Abrir no dashboard de KPI leva você à métrica. Fechar (ou Esc) recolhe o bloco.
Vincule um KPI a uma métrica
Um KPI mostra valores depois que tem uma métrica e um objeto de métrica. Até lá, o bloco mostra um espaço reservado tracejado.
- Na seção Indicadores e metas, clique em Editar (ou clique em Vincular métrica / Selecionar objeto de métrica diretamente no espaço reservado).
- Na coluna Métrica, escolha a métrica e o objeto em que ela é medida.
- Clique em Concluído.
A métrica precisa ter um plano mensal para o ano do plano. As métricas de KPI também são adicionadas ao dashboard de KPI principal do plano (veja Configurações → Dashboard de KPI principal), se você puder editar esse dashboard.
Intervalo e Período, no alto da lista de edição, definem como o gráfico de tendência do KPI abre. É uma única configuração para todos os KPIs do plano.
KPIs medidos em um projeto
Se o objeto de métrica de um KPI for um projeto que você pode editar, o bloco oferece Adicionar às métricas do projeto. Isso adiciona a métrica ao visualizador de métricas do projeto e ativa a seção de métricas do projeto. Se o projeto já a exibe, o TeamGuru avisa e não altera nada.
De que ano são os KPIs exibidos?
Do ano do plano. Por padrão, é o ano fiscal atual; você pode revisar outro ano nas configurações do plano (veja Como alterar as configurações de uma X-matrix). Os valores acumulados no ano vão até o último mês fechado.
Precisa de mais ajuda?
Escreva para nós. Em dias úteis, costumamos responder em até uma hora.