Cómo hacer el seguimiento de los KPI (Metas de mejora) en una X-matrix
Traducción automática del inglés. Se muestra el original en inglés.
The fourth list of the matrix holds your KPIs – by default called Targets to Improve. Each KPI gets its own tile in the section below the matrix, so you see the whole story of the year.

What a tile shows
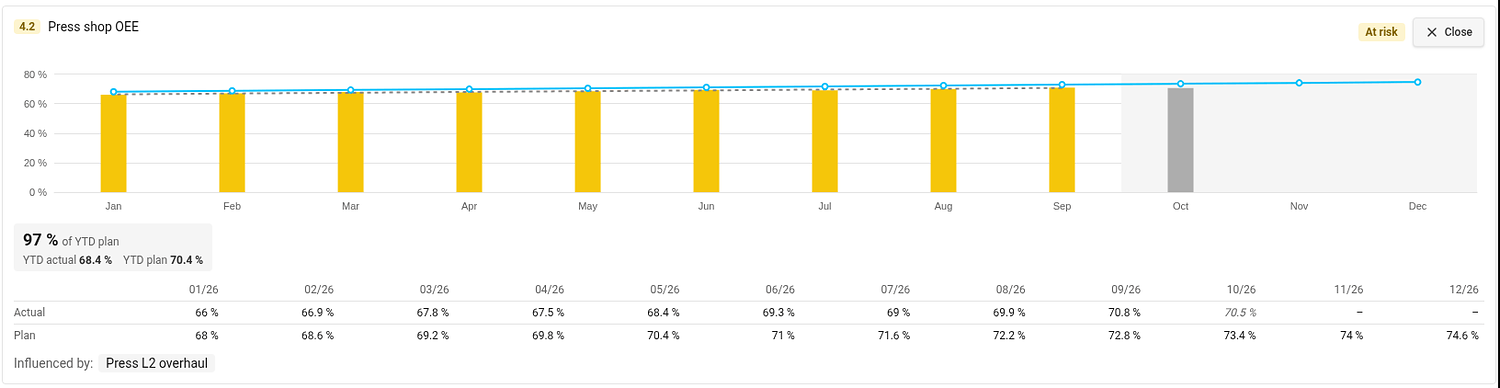
- Bars – the actual value of each month. The color of a bar is the status of that month, taken from the color coding of the metric. A gray bar is the month in progress: it is not rated, because its value may still be incomplete.
- Blue line – the monthly plan. The rest of the year is shaded.
- YTD box – the share of the year-to-date plan met (for example 97 % of YTD plan) with the YTD actual and YTD plan it compares.
- Status in the top right corner. Hover over it to see how it was calculated.
Values are shown in the unit of the metric on the plan’s main metric dashboard, and the unit is printed next to the numbers and on the axis.
Open the detail
Click the magnifier on a tile. The tile opens across the page with a taller chart, a gray dashed trend line, a table of the monthly actual and plan values and the projects that influence the KPI (Influenced by). Open on the metric dashboard takes you to the metric. Close (or Esc) folds the tile back.
Connect a KPI to a metric
A KPI shows values once it has both a metric and a metric object. Until then its tile shows a dashed placeholder.
- In the section Targets to Improve click Edit (or click Connect metric / Select metric object directly in the placeholder).
- In the Metric column choose the metric and the object it is measured on.
- Click Done.
The metric needs a monthly plan for the plan year. KPI metrics are also added to the main metric dashboard of the plan (see Settings → Main metric dashboard), if you may edit that dashboard.
Interval and Period at the top of the edit list set how the trend graph of the KPI opens. They are one setting for all KPIs of the plan.
KPIs measured on a project
If the metric object of a KPI is a project you may edit, the tile offers Add to project metrics. It adds the metric to the project’s metric viewer and turns on the project metrics section of the project. If the project already shows it, TeamGuru tells you and changes nothing.
Which year do the KPIs show?
The plan year. By default it is the current fiscal year; you can review another one in the plan settings (see How to change the settings of an X-matrix). The year-to-date values run up to the last closed month.
La cuarta lista de la matriz contiene sus KPI, que de forma predeterminada se llaman Metas de mejora. Cada KPI tiene su propio mosaico en la sección que hay debajo de la matriz, para que vea la evolución completa del año.
Qué muestra un mosaico
- Barras: el valor real de cada mes. El color de una barra es el estado de ese mes, según el código de colores de la métrica. Una barra gris es el mes en curso: no se evalúa porque su valor aún puede estar incompleto.
- Línea azul: el plan mensual. El resto del año aparece sombreado.
- Recuadro acumulado del año: el porcentaje del plan acumulado del año que se ha cumplido (por ejemplo, 97 % del plan acumulado) junto con el real acumulado y el plan acumulado que se comparan.
- Estado en la esquina superior derecha. Pase el cursor sobre él para ver cómo se calculó.
Los valores se muestran en la unidad de la métrica del dashboard de KPI principal del plan, y la unidad aparece junto a las cifras y en el eje.
Abrir el detalle
Haga clic en la lupa de un mosaico. El mosaico se abre a lo ancho de la página con un gráfico más alto, una línea de tendencia gris discontinua, una tabla con los valores reales y planificados de cada mes y los proyectos que influyen en el KPI (Influido por). Abrir en el dashboard de KPI le lleva a la métrica. Cerrar (o Esc) vuelve a plegar el mosaico.
Conectar un KPI con una métrica
Un KPI muestra valores cuando tiene una métrica y un objeto de métrica. Hasta entonces, su mosaico muestra un marcador discontinuo.
- En la sección Metas de mejora, haga clic en Editar (o haga clic en Conectar métrica / Seleccionar objeto de métrica directamente en el marcador).
- En la columna Métrica, elija la métrica y el objeto sobre el que se mide.
- Haga clic en Listo.
La métrica necesita un plan mensual para el año del plan. Las métricas de los KPI también se agregan al dashboard de KPI principal del plan (consulte Configuración → Dashboard de KPI principal), si usted puede editar ese dashboard.
Intervalo y Periodo, en la parte superior de la lista de edición, definen cómo se abre el gráfico de tendencia del KPI. Son una sola configuración para todos los KPI del plan.
KPI medidos en un proyecto
Si el objeto de métrica de un KPI es un proyecto que usted puede editar, el mosaico ofrece Agregar a las métricas del proyecto. Esto agrega la métrica al visor de métricas del proyecto y activa la sección de métricas del proyecto. Si el proyecto ya la muestra, TeamGuru se lo indica y no cambia nada.
¿Qué año muestran los KPI?
El año del plan. De forma predeterminada es el año fiscal actual; puede revisar otro en la configuración del plan (consulte Cómo cambiar la configuración de una X-matrix). Los valores acumulados del año llegan hasta el último mes cerrado.
¿Necesita más ayuda?
Escríbanos. En días laborables solemos responder en menos de una hora.