So verfolgen Sie KPIs (Zielwerte) in einer X-Matrix
Maschinelle Übersetzung aus dem Englischen. Englisches Original wird angezeigt.
The fourth list of the matrix holds your KPIs – by default called Targets to Improve. Each KPI gets its own tile in the section below the matrix, so you see the whole story of the year.

What a tile shows
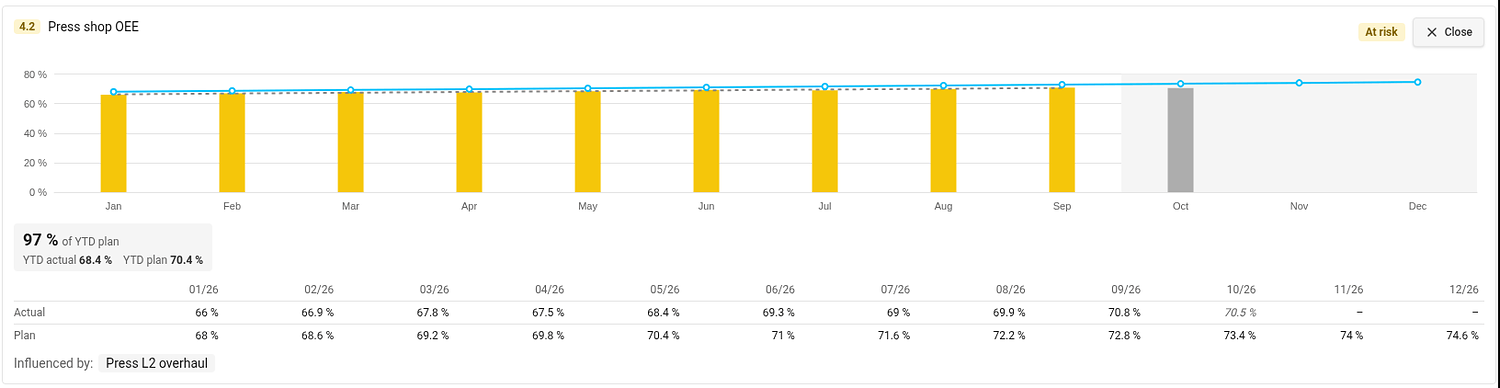
- Bars – the actual value of each month. The color of a bar is the status of that month, taken from the color coding of the metric. A gray bar is the month in progress: it is not rated, because its value may still be incomplete.
- Blue line – the monthly plan. The rest of the year is shaded.
- YTD box – the share of the year-to-date plan met (for example 97 % of YTD plan) with the YTD actual and YTD plan it compares.
- Status in the top right corner. Hover over it to see how it was calculated.
Values are shown in the unit of the metric on the plan’s main metric dashboard, and the unit is printed next to the numbers and on the axis.
Open the detail
Click the magnifier on a tile. The tile opens across the page with a taller chart, a gray dashed trend line, a table of the monthly actual and plan values and the projects that influence the KPI (Influenced by). Open on the metric dashboard takes you to the metric. Close (or Esc) folds the tile back.
Connect a KPI to a metric
A KPI shows values once it has both a metric and a metric object. Until then its tile shows a dashed placeholder.
- In the section Targets to Improve click Edit (or click Connect metric / Select metric object directly in the placeholder).
- In the Metric column choose the metric and the object it is measured on.
- Click Done.
The metric needs a monthly plan for the plan year. KPI metrics are also added to the main metric dashboard of the plan (see Settings → Main metric dashboard), if you may edit that dashboard.
Interval and Period at the top of the edit list set how the trend graph of the KPI opens. They are one setting for all KPIs of the plan.
KPIs measured on a project
If the metric object of a KPI is a project you may edit, the tile offers Add to project metrics. It adds the metric to the project’s metric viewer and turns on the project metrics section of the project. If the project already shows it, TeamGuru tells you and changes nothing.
Which year do the KPIs show?
The plan year. By default it is the current fiscal year; you can review another one in the plan settings (see How to change the settings of an X-matrix). The year-to-date values run up to the last closed month.
Die vierte Liste der Matrix enthält Ihre KPIs – standardmäßig heißt sie Zielwerte. Jeder KPI erhält im Abschnitt unter der Matrix eine eigene Kachel, sodass Sie den Verlauf des ganzen Jahres sehen.
Was eine Kachel zeigt
- Balken – der Ist-Wert jedes Monats. Die Farbe eines Balkens ist der Status dieses Monats laut Farbcodierung der Kennzahl. Ein grauer Balken ist der laufende Monat: Er wird nicht bewertet, weil sein Wert noch unvollständig sein kann.
- Blaue Linie – der Monatsplan. Der Rest des Jahres ist schattiert.
- YTD-Feld – der Anteil des erfüllten Plans seit Jahresbeginn (zum Beispiel 97 % des YTD-Plans) mit dem Ist YTD und dem Plan YTD, die verglichen werden.
- Status oben rechts. Fahren Sie mit der Maus darüber, um zu sehen, wie er berechnet wurde.
Die Werte erscheinen in der Einheit der Kennzahl im Haupt-KPI-Dashboard des Plans; die Einheit steht neben den Zahlen und an der Achse.
Details öffnen
Klicken Sie auf die Lupe einer Kachel. Die Kachel öffnet sich über die ganze Seitenbreite mit einem höheren Diagramm, einer grauen gestrichelten Trendlinie, einer Tabelle der monatlichen Ist- und Planwerte und den Projekten, die den KPI beeinflussen (Beeinflusst durch). Im KPI-Dashboard öffnen führt Sie zur Kennzahl. Schließen (oder Esc) klappt die Kachel wieder zu.
KPI mit einer Kennzahl verbinden
Ein KPI zeigt Werte an, sobald er eine Kennzahl und ein Kennzahlobjekt hat. Bis dahin zeigt seine Kachel einen gestrichelten Platzhalter.
- Klicken Sie im Abschnitt Zielwerte auf Bearbeiten (oder direkt im Platzhalter auf Kennzahl verbinden / Kennzahlobjekt auswählen).
- Wählen Sie in der Spalte Kennzahl die Kennzahl und das Objekt, an dem sie gemessen wird.
- Klicken Sie auf Fertig.
Die Kennzahl braucht einen Monatsplan für das Planjahr. KPI-Kennzahlen werden außerdem dem Haupt-KPI-Dashboard des Plans hinzugefügt (siehe Einstellungen → Haupt-KPI-Dashboard), sofern Sie dieses Dashboard bearbeiten dürfen.
Intervall und Zeitraum oben in der Bearbeitungsliste legen fest, wie das Trenddiagramm des KPI geöffnet wird. Diese Einstellung gilt für alle KPIs des Plans.
An einem Projekt gemessene KPIs
Ist das Kennzahlobjekt eines KPI ein Projekt, das Sie bearbeiten dürfen, bietet die Kachel Zu Projektkennzahlen hinzufügen an. Damit wird die Kennzahl der Kennzahlansicht des Projekts hinzugefügt und der Abschnitt Projektkennzahlen im Projekt aktiviert. Zeigt das Projekt sie bereits an, weist TeamGuru Sie darauf hin und ändert nichts.
Welches Jahr zeigen die KPIs?
Das Planjahr. Standardmäßig ist es das aktuelle Geschäftsjahr; in den Planeinstellungen können Sie ein anderes wählen (siehe So ändern Sie die Einstellungen einer X-Matrix). Die Werte seit Jahresbeginn reichen bis zum letzten abgeschlossenen Monat.
Brauchen Sie weitere Hilfe?
Schreiben Sie uns. An Werktagen antworten wir meist innerhalb einer Stunde.