如何在X-matrix中跟踪KPI(改进目标)
本文由英文机器翻译。 当前显示英文原文。
The fourth list of the matrix holds your KPIs – by default called Targets to Improve. Each KPI gets its own tile in the section below the matrix, so you see the whole story of the year.

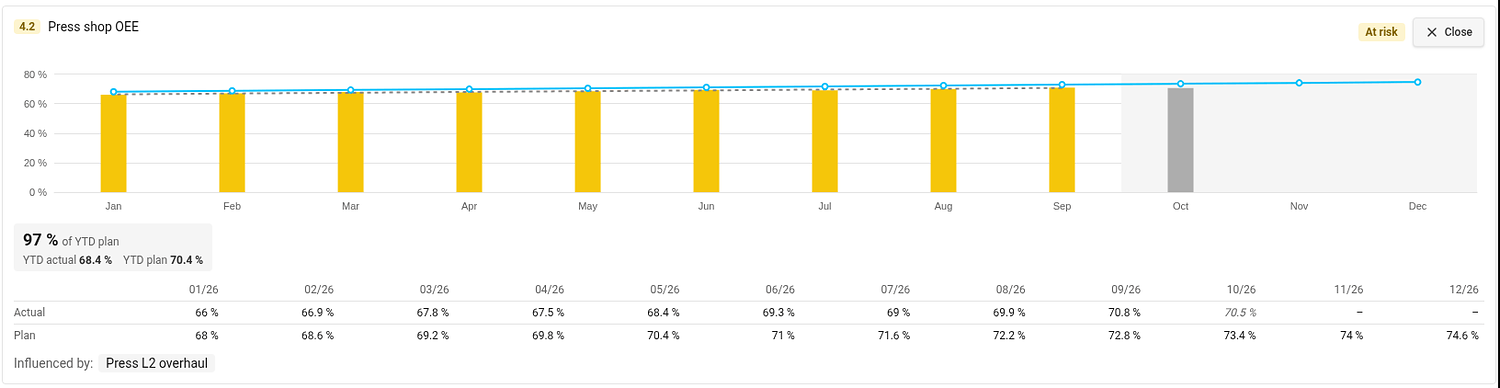
What a tile shows
- Bars – the actual value of each month. The color of a bar is the status of that month, taken from the color coding of the metric. A gray bar is the month in progress: it is not rated, because its value may still be incomplete.
- Blue line – the monthly plan. The rest of the year is shaded.
- YTD box – the share of the year-to-date plan met (for example 97 % of YTD plan) with the YTD actual and YTD plan it compares.
- Status in the top right corner. Hover over it to see how it was calculated.
Values are shown in the unit of the metric on the plan’s main metric dashboard, and the unit is printed next to the numbers and on the axis.
Open the detail
Click the magnifier on a tile. The tile opens across the page with a taller chart, a gray dashed trend line, a table of the monthly actual and plan values and the projects that influence the KPI (Influenced by). Open on the metric dashboard takes you to the metric. Close (or Esc) folds the tile back.
Connect a KPI to a metric
A KPI shows values once it has both a metric and a metric object. Until then its tile shows a dashed placeholder.
- In the section Targets to Improve click Edit (or click Connect metric / Select metric object directly in the placeholder).
- In the Metric column choose the metric and the object it is measured on.
- Click Done.
The metric needs a monthly plan for the plan year. KPI metrics are also added to the main metric dashboard of the plan (see Settings → Main metric dashboard), if you may edit that dashboard.
Interval and Period at the top of the edit list set how the trend graph of the KPI opens. They are one setting for all KPIs of the plan.
KPIs measured on a project
If the metric object of a KPI is a project you may edit, the tile offers Add to project metrics. It adds the metric to the project’s metric viewer and turns on the project metrics section of the project. If the project already shows it, TeamGuru tells you and changes nothing.
Which year do the KPIs show?
The plan year. By default it is the current fiscal year; you can review another one in the plan settings (see How to change the settings of an X-matrix). The year-to-date values run up to the last closed month.
矩阵的第四个列表存放您的KPI,默认名称为改进目标。每个KPI在矩阵下方的部分中都有自己的图块,让您全面了解全年情况。
图块显示的内容
- 柱形:每个月的实际值。柱形的颜色表示该月的状态,取自指标的颜色编码。灰色柱形表示当前进行中的月份:该月不评级,因为其数值可能尚不完整。
- 蓝线:月度计划。全年剩余时间以阴影显示。
- 年初至今框:年初至今计划的完成比例(例如年初至今计划的97%),以及用于比较的年初至今实际和年初至今计划。
- 右上角的状态。将鼠标悬停在上面即可查看其计算方式。
数值以计划主指标仪表板上该指标的单位显示,单位标注在数字旁和坐标轴上。
打开详细信息
点击图块上的放大镜。图块会横向展开占满页面,显示更高的图表、灰色虚线趋势线、月度实际值和计划值表格,以及影响该KPI的项目(影响因素)。在指标仪表板中打开可跳转到该指标。点击关闭(或按Esc键)可将图块收起。
将KPI关联到指标
KPI同时具有指标和指标对象后才会显示数值。在此之前,其图块显示为虚线占位符。
- 在改进目标部分点击编辑(或直接点击占位符中的关联指标 / 选择指标对象)。
- 在指标列中选择指标及其衡量的对象。
- 点击完成。
该指标需要有计划年度的月度计划。如果您有权编辑计划的主指标仪表板(参见设置 → 主指标仪表板),KPI指标也会添加到该仪表板中。
编辑列表顶部的间隔和期间用于设置KPI趋势图的默认打开方式。这是计划中所有KPI共用的一项设置。
在项目上衡量的KPI
如果KPI的指标对象是您可以编辑的项目,图块会提供添加到项目指标选项。它会将该指标添加到项目的指标查看器中,并开启项目的项目指标部分。如果项目中已显示该指标,TeamGuru会提示您,且不做任何更改。
KPI显示哪一年的数据?
显示计划年度的数据。默认为当前财年;您可以在计划设置中查看其他年度(参见如何更改X-matrix的设置)。年初至今的数值截至最近一个已结束的月份。
还需要帮助吗?
请给我们留言。工作日我们通常会在一小时内回复。