Jak śledzić KPI (wartości docelowe) w X-Matrix
Tłumaczenie maszynowe z angielskiego. Wyświetlany jest oryginał po angielsku.
The fourth list of the matrix holds your KPIs – by default called Targets to Improve. Each KPI gets its own tile in the section below the matrix, so you see the whole story of the year.

What a tile shows
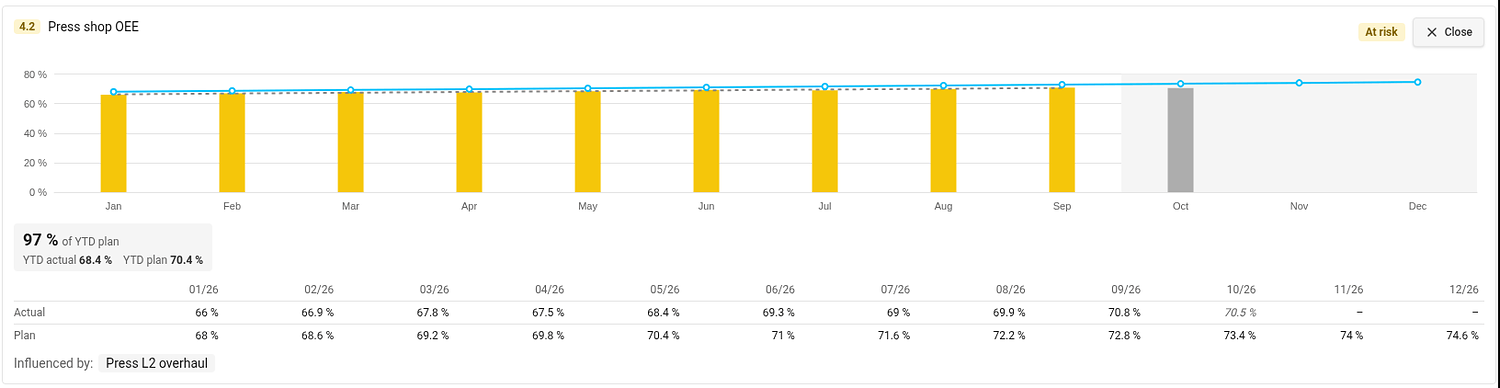
- Bars – the actual value of each month. The color of a bar is the status of that month, taken from the color coding of the metric. A gray bar is the month in progress: it is not rated, because its value may still be incomplete.
- Blue line – the monthly plan. The rest of the year is shaded.
- YTD box – the share of the year-to-date plan met (for example 97 % of YTD plan) with the YTD actual and YTD plan it compares.
- Status in the top right corner. Hover over it to see how it was calculated.
Values are shown in the unit of the metric on the plan’s main metric dashboard, and the unit is printed next to the numbers and on the axis.
Open the detail
Click the magnifier on a tile. The tile opens across the page with a taller chart, a gray dashed trend line, a table of the monthly actual and plan values and the projects that influence the KPI (Influenced by). Open on the metric dashboard takes you to the metric. Close (or Esc) folds the tile back.
Connect a KPI to a metric
A KPI shows values once it has both a metric and a metric object. Until then its tile shows a dashed placeholder.
- In the section Targets to Improve click Edit (or click Connect metric / Select metric object directly in the placeholder).
- In the Metric column choose the metric and the object it is measured on.
- Click Done.
The metric needs a monthly plan for the plan year. KPI metrics are also added to the main metric dashboard of the plan (see Settings → Main metric dashboard), if you may edit that dashboard.
Interval and Period at the top of the edit list set how the trend graph of the KPI opens. They are one setting for all KPIs of the plan.
KPIs measured on a project
If the metric object of a KPI is a project you may edit, the tile offers Add to project metrics. It adds the metric to the project’s metric viewer and turns on the project metrics section of the project. If the project already shows it, TeamGuru tells you and changes nothing.
Which year do the KPIs show?
The plan year. By default it is the current fiscal year; you can review another one in the plan settings (see How to change the settings of an X-matrix). The year-to-date values run up to the last closed month.
Czwarta lista matrycy zawiera KPI, domyślnie nazwane Wartości docelowe. Każdy KPI ma własny kafelek w sekcji pod matrycą, więc widzisz przebieg całego roku.
Co pokazuje kafelek
- Słupki: wykonanie w każdym miesiącu. Kolor słupka to status danego miesiąca, wzięty z kolorowego oznaczenia wskaźnika. Szary słupek to bieżący miesiąc: nie jest oceniany, bo jego wartość może być jeszcze niepełna.
- Niebieska linia: plan miesięczny. Pozostała część roku jest zacieniona.
- Pole z wynikiem narastająco: procent realizacji planu narastająco od początku roku (np. 97 % planu narastająco) wraz z porównywanymi wartościami Wykonanie narastająco i Plan narastająco.
- Status w prawym górnym rogu. Najedź na niego kursorem, aby zobaczyć, jak został obliczony.
Wartości są podawane w jednostce wskaźnika z głównego dashboardu KPI planu, a jednostka widnieje obok liczb i na osi.
Otwórz szczegóły
Kliknij lupę na kafelku. Kafelek rozwinie się na całą szerokość strony z wyższym wykresem, szarą przerywaną linią trendu, tabelą miesięcznych wartości wykonania i planu oraz projektami, które wpływają na KPI (Na wynik wpływają). Otwórz na dashboardzie KPI przenosi cię do wskaźnika. Zamknij (lub Esc) zwija kafelek.
Połącz KPI ze wskaźnikiem
KPI pokazuje wartości, gdy ma przypisany wskaźnik i obiekt wskaźnika. Do tego czasu kafelek pokazuje przerywaną ramkę zastępczą.
- W sekcji Wartości docelowe kliknij Edytuj (albo kliknij Połącz wskaźnik / Wybierz obiekt wskaźnika bezpośrednio w ramce zastępczej).
- W kolumnie Wskaźnik wybierz wskaźnik i obiekt, dla którego jest mierzony.
- Kliknij Gotowe.
Wskaźnik musi mieć plan miesięczny na rok planu. Wskaźniki KPI są też dodawane do głównego dashboardu KPI planu (zobacz Ustawienia → Główny dashboard KPI), jeśli możesz edytować ten dashboard.
Interwał i Okres na górze listy edycji określają, jak otwiera się wykres trendu KPI. To jedno ustawienie dla wszystkich KPI planu.
KPI mierzone dla projektu
Jeśli obiektem wskaźnika KPI jest projekt, który możesz edytować, kafelek oferuje opcję Dodaj do wskaźników projektu. Dodaje ona wskaźnik do przeglądu wskaźników projektu i włącza w projekcie sekcję wskaźników projektu. Jeśli projekt już go pokazuje, TeamGuru poinformuje cię o tym i niczego nie zmieni.
Który rok pokazują KPI?
Rok planu. Domyślnie jest to bieżący rok obrachunkowy; inny rok możesz przejrzeć w ustawieniach planu (zobacz Jak zmienić ustawienia X-Matrix). Wartości narastająco od początku roku obejmują okres do ostatniego zamkniętego miesiąca.
Potrzebujesz dalszej pomocy?
Napisz do nas. W dni robocze zwykle odpowiadamy w ciągu godziny.