Suivre les KPI (cibles à améliorer) dans une X-Matrix
Traduction automatique de l'anglais. Original en anglais affiché.
The fourth list of the matrix holds your KPIs – by default called Targets to Improve. Each KPI gets its own tile in the section below the matrix, so you see the whole story of the year.

What a tile shows
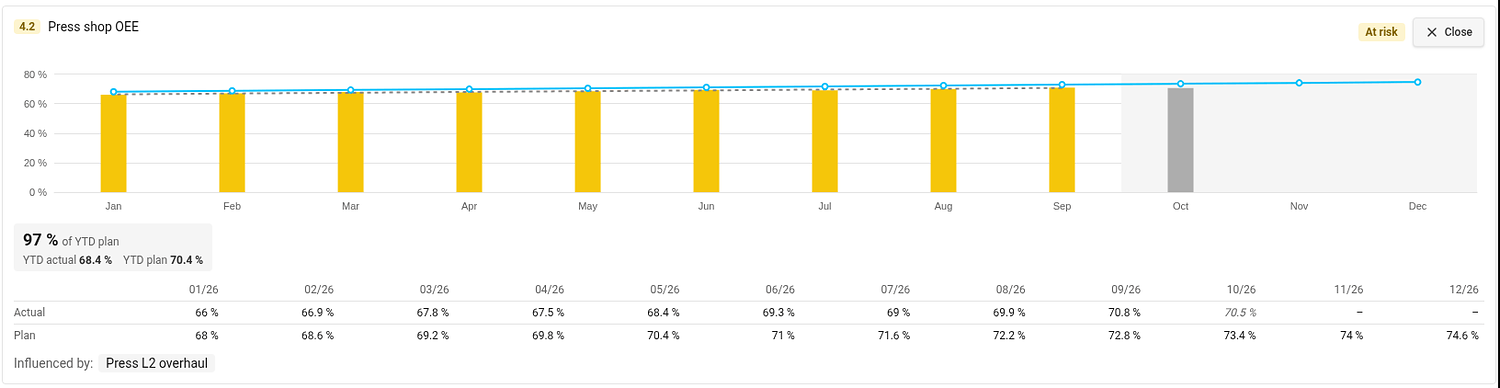
- Bars – the actual value of each month. The color of a bar is the status of that month, taken from the color coding of the metric. A gray bar is the month in progress: it is not rated, because its value may still be incomplete.
- Blue line – the monthly plan. The rest of the year is shaded.
- YTD box – the share of the year-to-date plan met (for example 97 % of YTD plan) with the YTD actual and YTD plan it compares.
- Status in the top right corner. Hover over it to see how it was calculated.
Values are shown in the unit of the metric on the plan’s main metric dashboard, and the unit is printed next to the numbers and on the axis.
Open the detail
Click the magnifier on a tile. The tile opens across the page with a taller chart, a gray dashed trend line, a table of the monthly actual and plan values and the projects that influence the KPI (Influenced by). Open on the metric dashboard takes you to the metric. Close (or Esc) folds the tile back.
Connect a KPI to a metric
A KPI shows values once it has both a metric and a metric object. Until then its tile shows a dashed placeholder.
- In the section Targets to Improve click Edit (or click Connect metric / Select metric object directly in the placeholder).
- In the Metric column choose the metric and the object it is measured on.
- Click Done.
The metric needs a monthly plan for the plan year. KPI metrics are also added to the main metric dashboard of the plan (see Settings → Main metric dashboard), if you may edit that dashboard.
Interval and Period at the top of the edit list set how the trend graph of the KPI opens. They are one setting for all KPIs of the plan.
KPIs measured on a project
If the metric object of a KPI is a project you may edit, the tile offers Add to project metrics. It adds the metric to the project’s metric viewer and turns on the project metrics section of the project. If the project already shows it, TeamGuru tells you and changes nothing.
Which year do the KPIs show?
The plan year. By default it is the current fiscal year; you can review another one in the plan settings (see How to change the settings of an X-matrix). The year-to-date values run up to the last closed month.
La quatrième liste de la matrice contient vos KPI, appelés par défaut Cibles à améliorer. Chaque KPI a sa propre vignette dans la section sous la matrice : vous voyez toute l’histoire de l’année.
Ce qu’affiche une vignette
- Barres – la valeur réelle de chaque mois. La couleur d’une barre est le statut du mois, tiré du code couleur de l’indicateur. Une barre grise est le mois en cours : il n’est pas évalué, car sa valeur peut encore être incomplète.
- Ligne bleue – le plan mensuel. Le reste de l’année est grisé.
- Encadré YTD – la part du plan cumulé atteinte depuis le début de l’année (par exemple 97 % du plan YTD), avec le réel YTD et le plan YTD comparés.
- Statut en haut à droite. Survolez-le pour voir comment il a été calculé.
Les valeurs s’affichent dans l’unité de l’indicateur du tableau de bord KPI principal du plan ; l’unité figure à côté des chiffres et sur l’axe.
Ouvrir le détail
Cliquez sur la loupe d’une vignette. Elle s’ouvre sur toute la largeur de la page avec un graphique plus haut, une ligne de tendance grise en pointillés, un tableau des valeurs mensuelles réelles et planifiées, et les projets qui influent sur le KPI (Influencé par). Ouvrir dans le tableau de bord KPI vous mène à l’indicateur. Fermer (ou Échap) replie la vignette.
Relier un KPI à un indicateur
Un KPI affiche des valeurs dès qu’il a un indicateur et un objet d’indicateur. En attendant, sa vignette affiche un espace réservé en pointillés.
- Dans la section Cibles à améliorer, cliquez sur Modifier (ou directement sur Relier un indicateur / Choisir l’objet de l’indicateur dans l’espace réservé).
- Dans la colonne Indicateur, choisissez l’indicateur et l’objet sur lequel il est mesuré.
- Cliquez sur Terminé.
L’indicateur doit avoir un plan mensuel pour l’année du plan. Les indicateurs des KPI sont aussi ajoutés au tableau de bord KPI principal du plan (voir Paramètres → Tableau de bord KPI principal), si vous pouvez modifier ce tableau de bord.
Intervalle et Période, en haut de la liste de modification, définissent comment s’ouvre le graphique de tendance du KPI. C’est un seul réglage pour tous les KPI du plan.
KPI mesurés sur un projet
Si l’objet d’indicateur d’un KPI est un projet que vous pouvez modifier, la vignette propose Ajouter aux indicateurs du projet. L’indicateur est alors ajouté à la visionneuse d’indicateurs du projet et la section des indicateurs du projet est activée. Si le projet l’affiche déjà, TeamGuru vous le signale et ne change rien.
Quelle année les KPI affichent-ils ?
L’année du plan. Par défaut, c’est l’exercice en cours ; vous pouvez en examiner un autre dans les paramètres du plan (voir Modifier les paramètres d’une X-Matrix). Les valeurs cumulées depuis le début de l’année vont jusqu’au dernier mois clôturé.
Besoin d'aide supplémentaire ?
Écrivez-nous. Les jours ouvrés, nous répondons en général en moins d'une heure.