How to add a metric chart into a report
The Reports module works together with the other TeamGuru modules. You can display a metric chart in a report that takes its data automatically from the system.
The data come directly from the database, so you don’t need to enter any data manually and your charts always show current values.
Create the chart
-
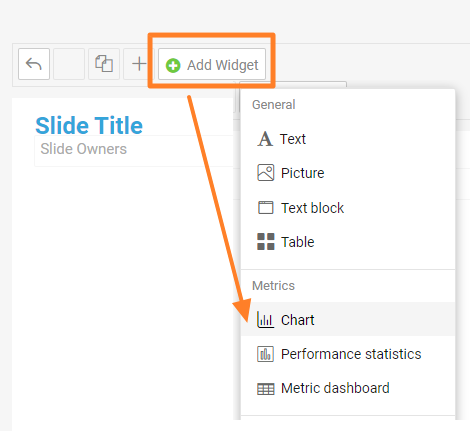
Add a Chart widget. Go to the slide, click Add Widget and choose Chart.
-
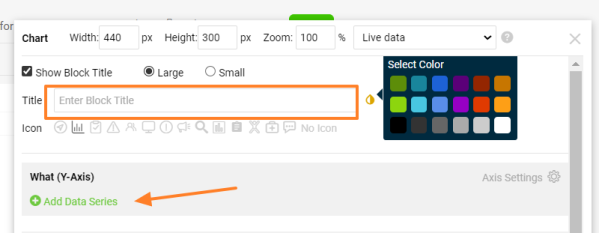
Enter the chart title. Add a Title for your chart, choose the title color and click Add Data Series.
-
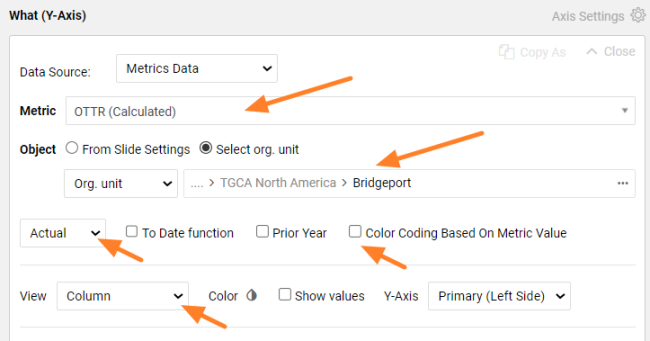
Define the data series. Select the metric and the organization unit you want to show. Choose the values you want to see (actual, plan, trend, etc.) and the view in the chart (column, line, etc.). Select Color Coding Based On Metric Value if you want red/green color coding.
-
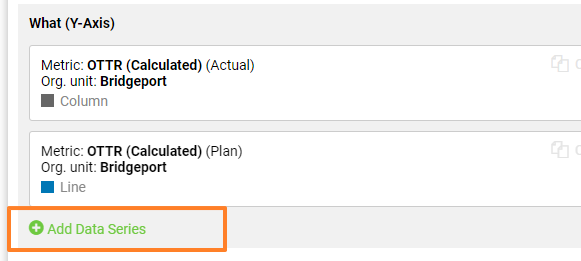
Add more data series. Click Add Data Series again if you want to show other metric data or another org. unit in the same chart. You can add as many items as you need.
-
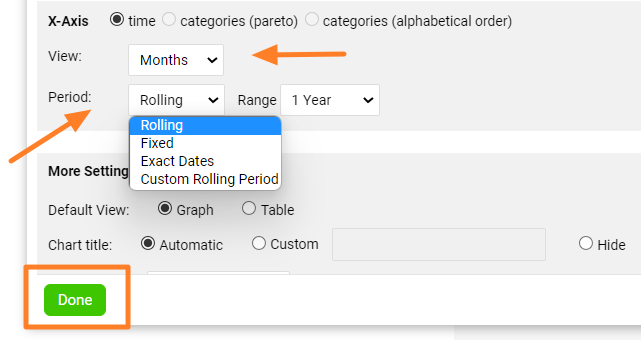
Set up the X-axis. Set up the X-axis View and the displayed Period, then click Done.
-
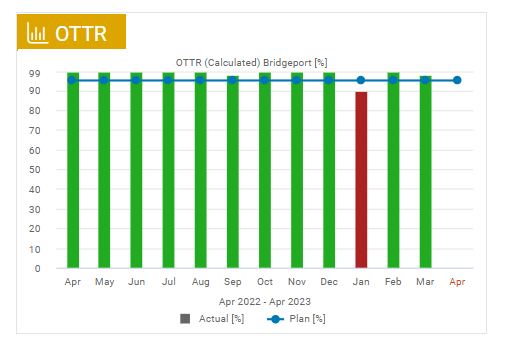
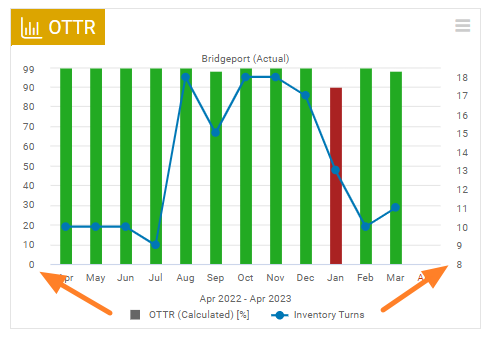
Check the chart. The metric chart is created, as in this example:
-
Save the slide. Click the Save button to save the slide updates.
Tips
Change the chart settings
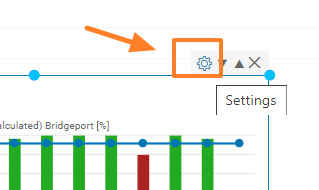
To change the settings of an existing chart, click its Settings icon.
Use a secondary Y-axis
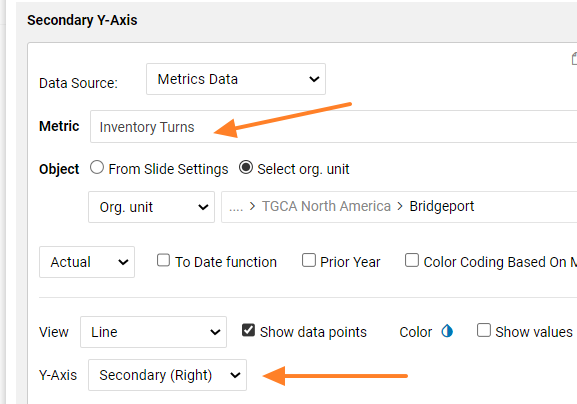
You can combine two different metrics in one chart and use two Y-axes. When you add a new metric series, choose Y-Axis Secondary (Right).
Still need help?
Write to us. We usually reply within an hour on business days.