Ako pridať graf metriky do reportu
Strojový preklad z angličtiny. Zobrazený je anglický originál.
The Reports module works together with the other TeamGuru modules. You can display a metric chart in a report that takes its data automatically from the system.
The data come directly from the database, so you don’t need to enter any data manually and your charts always show current values.
Create the chart
-
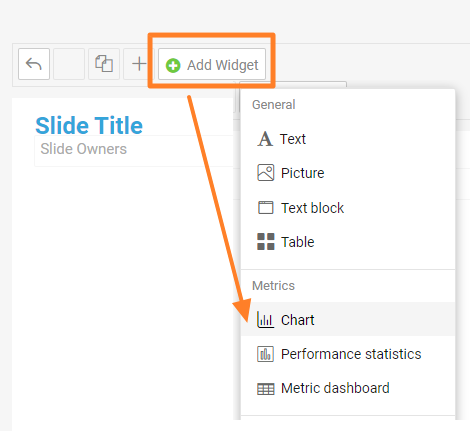
Add a Chart widget. Go to the slide, click Add Widget and choose Chart.
-
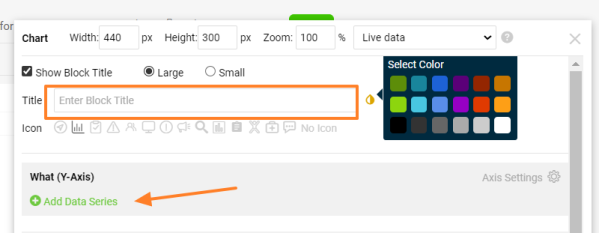
Enter the chart title. Add a Title for your chart, choose the title color and click Add Data Series.
-
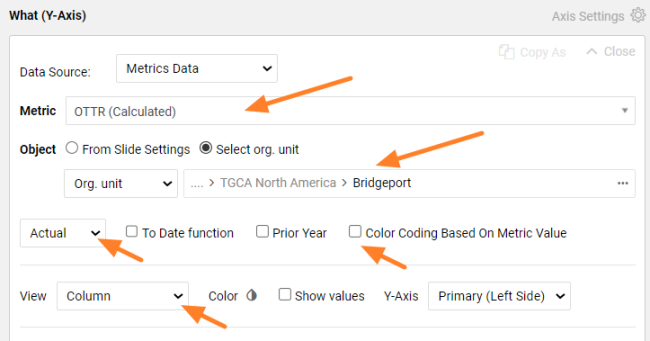
Define the data series. Select the metric and the organization unit you want to show. Choose the values you want to see (actual, plan, trend, etc.) and the view in the chart (column, line, etc.). Select Color Coding Based On Metric Value if you want red/green color coding.
-
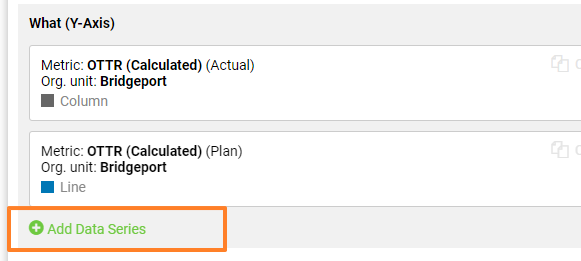
Add more data series. Click Add Data Series again if you want to show other metric data or another org. unit in the same chart. You can add as many items as you need.
-
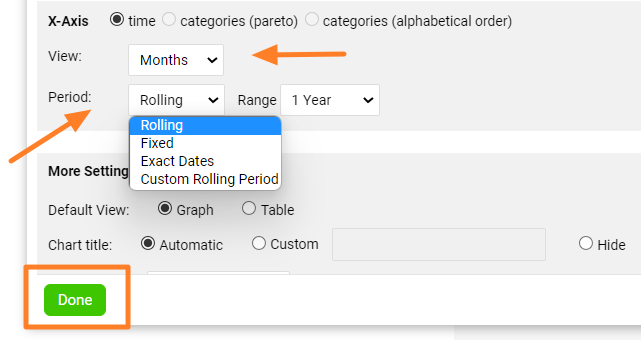
Set up the X-axis. Set up the X-axis View and the displayed Period, then click Done.
-
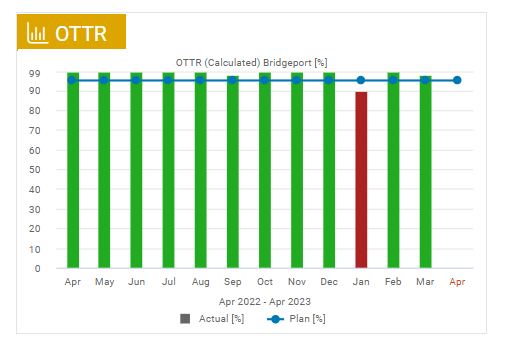
Check the chart. The metric chart is created, as in this example:
-
Save the slide. Click the Save button to save the slide updates.
Tips
Change the chart settings
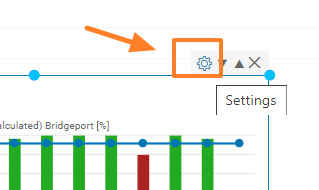
To change the settings of an existing chart, click its Settings icon.
Use a secondary Y-axis
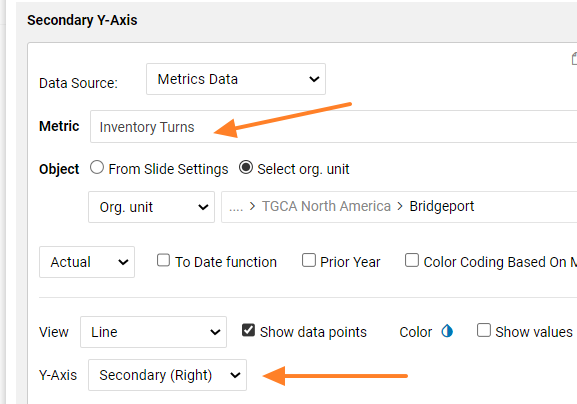
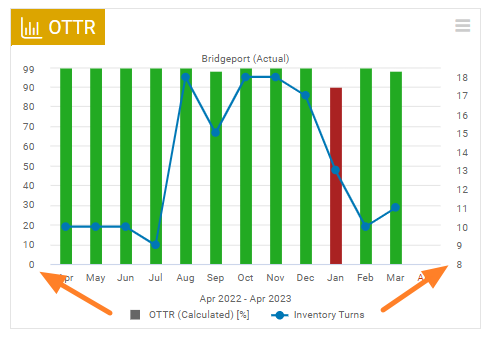
You can combine two different metrics in one chart and use two Y-axes. When you add a new metric series, choose Y-Axis Secondary (Right).
Modul Reporty spolupracuje s ostatnými modulmi TeamGuru. Do reportu môžete vložiť graf metriky, ktorý berie údaje automaticky zo systému.
Údaje idú priamo z databázy, takže nemusíte nič zadávať ručne a grafy vždy ukazujú aktuálne hodnoty.
Vytvorenie grafu
-
Pridajte widget Graf. Na snímke kliknite na Pridať widget a zvoľte Graf.
-
Zadajte názov grafu. Vyplňte Názov grafu, zvoľte farbu názvu a kliknite na Pridať dátový rad.
-
Nastavte dátový rad. Vyberte metriku a organizačnú jednotku, ktoré chcete zobraziť. Zvoľte hodnoty, ktoré chcete vidieť (skutočnosť, plán, trend atď.), a typ zobrazenia v grafe (stĺpcový, čiarový atď.). Ak chcete červeno-zelené farebné kódovanie, označte Farebné kódovanie podľa hodnoty metriky.
-
Pridajte ďalšie dátové rady. Ak chcete v tom istom grafe zobraziť ďalšie údaje metriky alebo inú org. jednotku, znova kliknite na Pridať dátový rad. Radov môžete pridať, koľko potrebujete.
-
Nastavte os X. Nastavte Zobrazenie osi X a zobrazené Obdobie a kliknite na Hotovo.
-
Skontrolujte graf. Graf metriky je vytvorený, napríklad takto:
-
Uložte snímku. Zmeny snímky uložíte tlačidlom Uložiť.
Tipy
Zmena nastavení grafu
Nastavenia existujúceho grafu zmeníte kliknutím na jeho ikonu Nastavenia.
Vedľajšia os Y
V jednom grafe môžete spojiť dve rôzne metriky a použiť dve osi Y. Pri pridávaní nového radu metriky zvoľte Os Y Vedľajšia (vpravo).
Potrebujete ďalšiu pomoc?
Napíšte nám. V pracovné dni zvyčajne odpovedáme do hodiny.