如何在报告中添加指标图表
本文由英文机器翻译。 当前显示英文原文。
The Reports module works together with the other TeamGuru modules. You can display a metric chart in a report that takes its data automatically from the system.
The data come directly from the database, so you don’t need to enter any data manually and your charts always show current values.
Create the chart
-
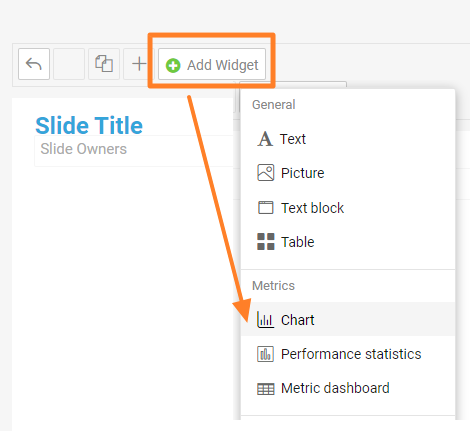
Add a Chart widget. Go to the slide, click Add Widget and choose Chart.
-
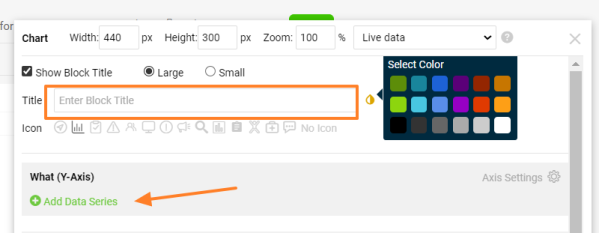
Enter the chart title. Add a Title for your chart, choose the title color and click Add Data Series.
-
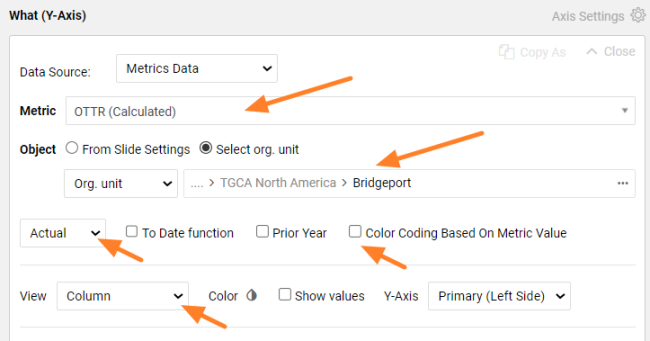
Define the data series. Select the metric and the organization unit you want to show. Choose the values you want to see (actual, plan, trend, etc.) and the view in the chart (column, line, etc.). Select Color Coding Based On Metric Value if you want red/green color coding.
-
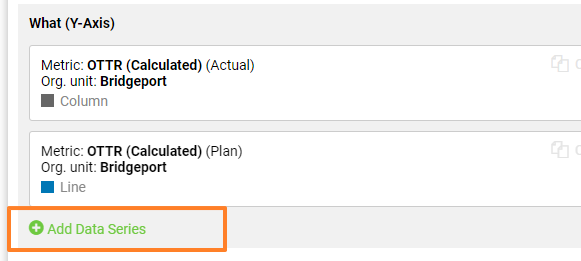
Add more data series. Click Add Data Series again if you want to show other metric data or another org. unit in the same chart. You can add as many items as you need.
-
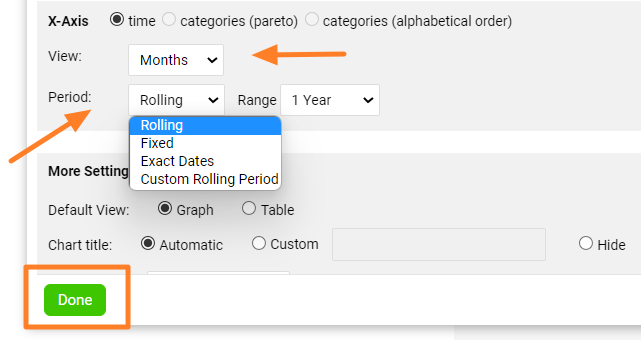
Set up the X-axis. Set up the X-axis View and the displayed Period, then click Done.
-
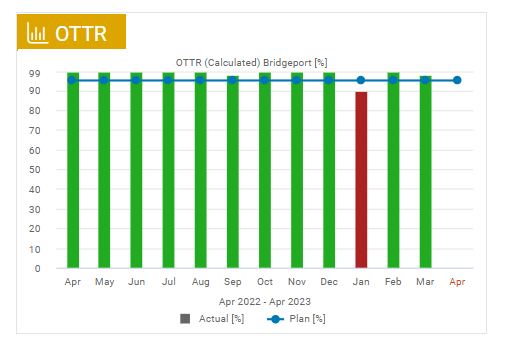
Check the chart. The metric chart is created, as in this example:
-
Save the slide. Click the Save button to save the slide updates.
Tips
Change the chart settings
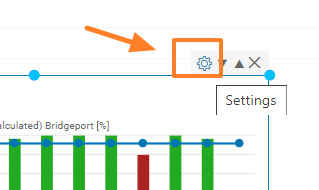
To change the settings of an existing chart, click its Settings icon.
Use a secondary Y-axis
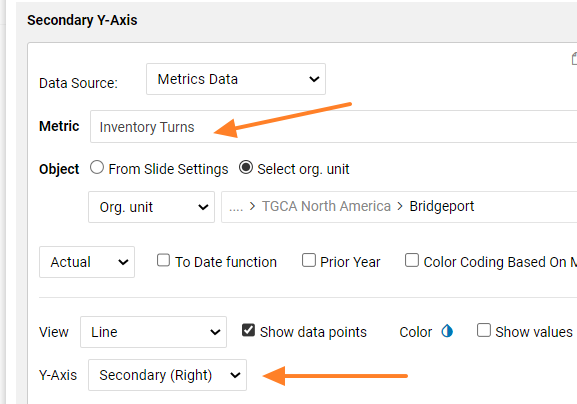
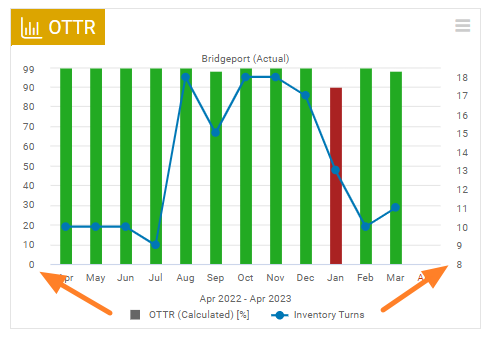
You can combine two different metrics in one chart and use two Y-axes. When you add a new metric series, choose Y-Axis Secondary (Right).
在TeamGuru中,报告 模块与其他模块协同工作。您可以在报告中显示指标图表,图表数据自动从系统中获取。
数据直接来自数据库,因此无需手动输入,图表始终显示最新数值。
创建图表
-
添加图表小部件。 进入幻灯片,点击 添加小部件 并选择 图表。
-
输入图表标题。 为图表添加 标题,选择标题颜色,然后点击 添加数据系列。
-
定义数据系列。 选择要显示的指标和组织单元。选择要查看的数值(实际值、计划值、趋势等)以及图表中的显示方式(柱形、折线等)。如需红/绿颜色标识,请选择 根据指标值显示颜色。
-
添加更多数据系列。 如需在同一图表中显示其他指标数据或其他组织单元,请再次点击 添加数据系列。可以根据需要添加任意数量的项目。
-
设置X轴。 设置X轴的 视图 和显示的 周期,然后点击 完成。
-
检查图表。 指标图表已创建,如下例所示:
-
保存幻灯片。 点击 保存 按钮保存幻灯片的更新。
提示
更改图表设置
要更改现有图表的设置,请点击其 设置 图标。
使用次Y轴
您可以在一个图表中组合两个不同的指标,并使用两条Y轴。添加新的指标系列时,在 Y轴 中选择 次坐标轴(右)。
还需要帮助吗?
请给我们留言。工作日我们通常会在一小时内回复。