Cómo agregar un gráfico de métrica a un informe
Traducción automática del inglés. Se muestra el original en inglés.
The Reports module works together with the other TeamGuru modules. You can display a metric chart in a report that takes its data automatically from the system.
The data come directly from the database, so you don’t need to enter any data manually and your charts always show current values.
Create the chart
-
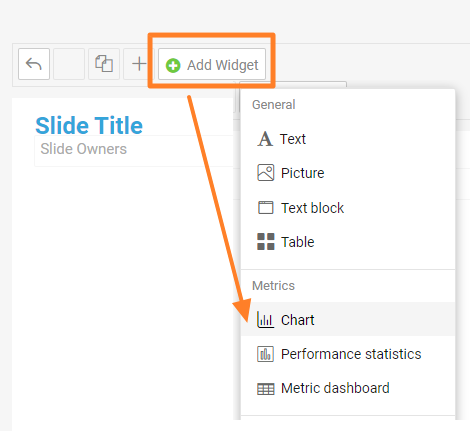
Add a Chart widget. Go to the slide, click Add Widget and choose Chart.
-
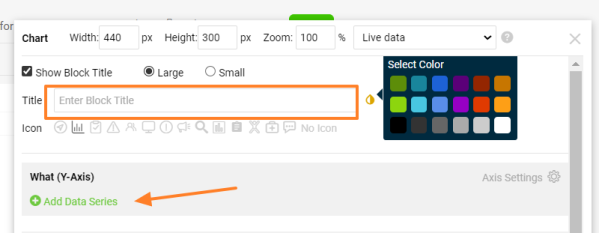
Enter the chart title. Add a Title for your chart, choose the title color and click Add Data Series.
-
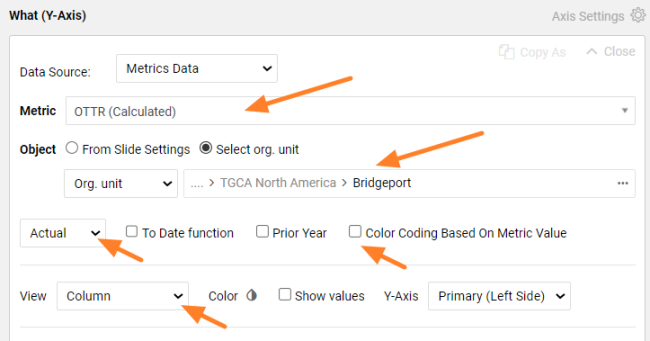
Define the data series. Select the metric and the organization unit you want to show. Choose the values you want to see (actual, plan, trend, etc.) and the view in the chart (column, line, etc.). Select Color Coding Based On Metric Value if you want red/green color coding.
-
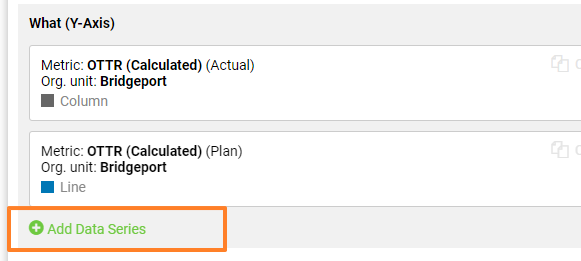
Add more data series. Click Add Data Series again if you want to show other metric data or another org. unit in the same chart. You can add as many items as you need.
-
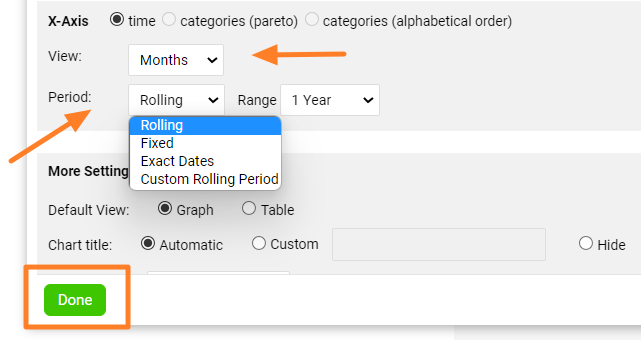
Set up the X-axis. Set up the X-axis View and the displayed Period, then click Done.
-
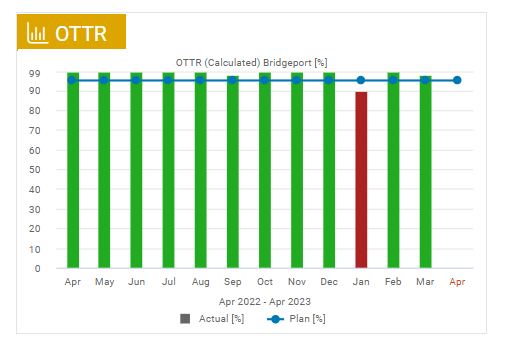
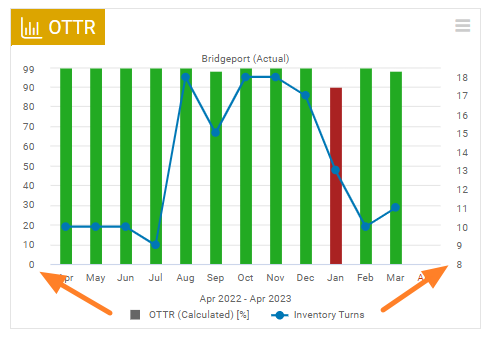
Check the chart. The metric chart is created, as in this example:
-
Save the slide. Click the Save button to save the slide updates.
Tips
Change the chart settings
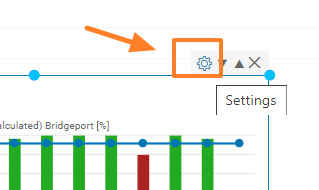
To change the settings of an existing chart, click its Settings icon.
Use a secondary Y-axis
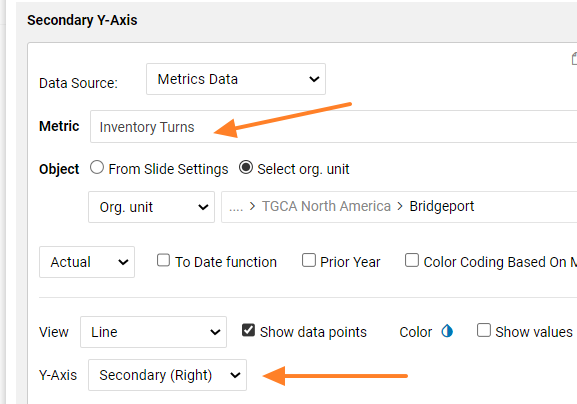
You can combine two different metrics in one chart and use two Y-axes. When you add a new metric series, choose Y-Axis Secondary (Right).
El módulo Informes funciona junto con los demás módulos de TeamGuru. Puede mostrar en un informe un gráfico de métrica que toma sus datos automáticamente del sistema.
Los datos provienen directamente de la base de datos, así que no necesita ingresar nada manualmente y los gráficos siempre muestran valores actuales.
Crear el gráfico
-
Agregue un widget de gráfico. Vaya a la diapositiva, haga clic en Agregar widget y elija Gráfico.
-
Escriba el título del gráfico. Agregue un Título al gráfico, elija el color del título y haga clic en Agregar serie de datos.
-
Defina la serie de datos. Seleccione la métrica y la unidad organizativa que quiere mostrar. Elija los valores que quiere ver (real, plan, tendencia, etc.) y la vista en el gráfico (columnas, línea, etc.). Seleccione Codificación por colores según el valor de la métrica si quiere colores rojo/verde.
-
Agregue más series de datos. Vuelva a hacer clic en Agregar serie de datos si quiere mostrar otros datos de la métrica u otra unidad organizativa en el mismo gráfico. Puede agregar tantas series como necesite.
-
Configure el eje X. Configure la Vista del eje X y el Período mostrado, y haga clic en Listo.
-
Revise el gráfico. El gráfico de métrica queda creado, como en este ejemplo:
-
Guarde la diapositiva. Haga clic en el botón Guardar para guardar los cambios de la diapositiva.
Consejos
Cambiar la configuración del gráfico
Para cambiar la configuración de un gráfico existente, haga clic en su icono Configuración.
Usar un eje Y secundario
Puede combinar dos métricas distintas en un gráfico y usar dos ejes Y. Al agregar una nueva serie de métrica, elija Eje Y Secundario (derecho).
¿Necesita más ayuda?
Escríbanos. En días laborables solemos responder en menos de una hora.