SQDIP Charts
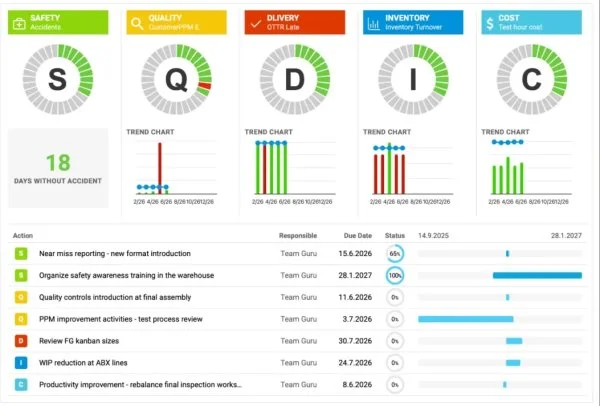
Use SQDIP charts as a visual tool to track performance in Safety, Quality, Delivery, Inventory and Productivity. They give your team a clear, real-time view of how operations are performing against targets, and each category highlights where issues or improvements may be needed. By presenting data in a simple, structured format, SQDIP charts help your team react quickly and stay aligned on priorities.
Key features
- Clear visual of a letter / period grid and a trend chart linked to each metric
- Lists all actions tied to the metric from the dashboard for a specific metric / org. unit / time period
- Built with any metric or object
- Customizable titles, colors and icons
- Can reference related RCCA and/or 8D
- Easy to move and reorder the metrics
- Charts show actual, plan and forecast values and different time intervals
- Shows the number of periods without an unachieved objective (e.g. # of days without incident)
- Add a new action directly from your widget
Create the SQDIP widget
-
Open the slide in edit mode. Go to your report slide and click Click to edit.
-
Add the SQDIP widget. Click Add Widget and select the Metric widget (SQDIP).

-
Customize the widget. The widget settings window pops up and you are ready to customize its design.
Customize the widget
-
Show the block title. Enable Show Block Title if you want to display a title. Then choose the title text, font size, color and icon.

-
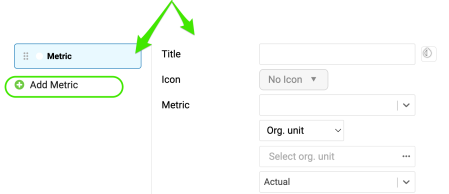
Add metrics. A default metric is displayed. You can start configuring it by adding the details you need. To add more metrics, click the Add Metric button and define them as well.
Define the metric settings
Choose the metric basics
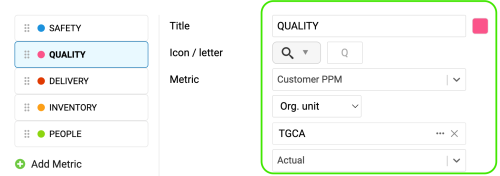
Choose the title, color, icon, metric, org. unit and type interval (actual data, last, next).
Set the time intervals
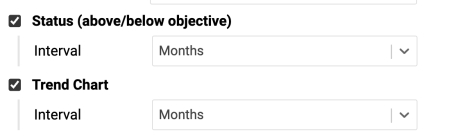
Select your metric time interval and the trend chart interval (e.g. daily, weekly, monthly data).
Count periods without an unachieved objective
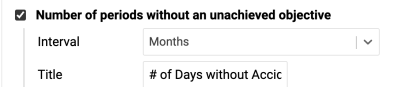
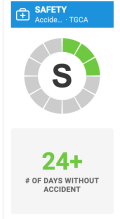
Number of periods without an unachieved objective: choose the interval and the title, e.g. “# of Days without Accident”.
Display single values
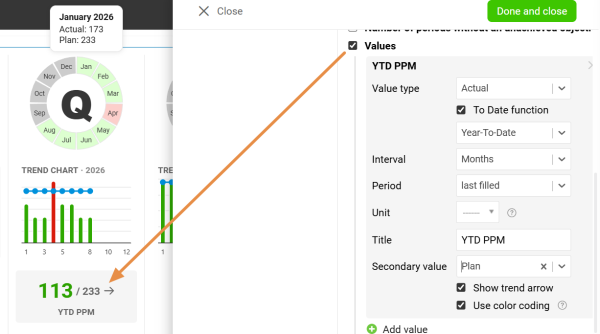
Values: display a single metric value for the selected time period.
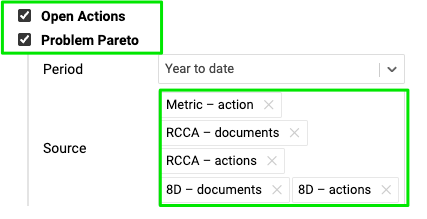
Display all open actions
Display all open actions for the combination of your metric / org. unit.
Include the Problem Pareto
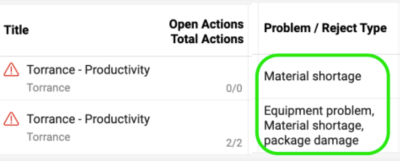
Include the Problem Pareto when needed, based on the applicable source documents.
The Problem Pareto displays the number of occurrences of each problem / reject type for the selected org. unit / metric combination. It also displays the cumulative percentage, showing the share of each problem in the total number of occurrences.

Choose the status visualization
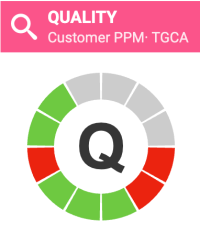
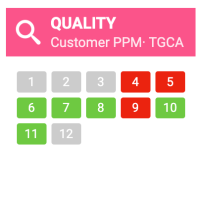
Choose the Status Visualization: Letter in circle or Period grid.

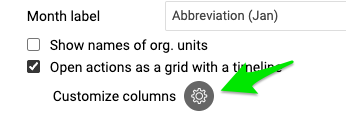
Show open actions on a timeline
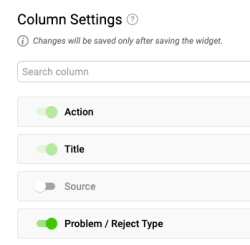
Display open actions as a grid with a timeline and Customize columns.

Add RCCA and 8D actions
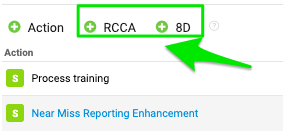
You also have options to show actions from RCCA and 8D documents and to show weekdays only. If you choose to show actions from RCCA and 8D, you can also initiate an RCCA or 8D directly from your slide.

Resize the widget and finish
Adjust the size of your widget and click the Done and close button.

Additional features
Add actions from the widget
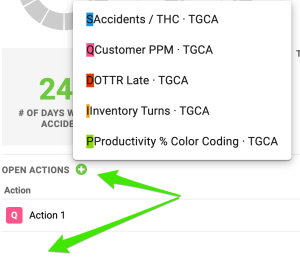
Add new actions directly from your widget: click Add action +, choose the combination and define the action settings.
Reorder the metrics
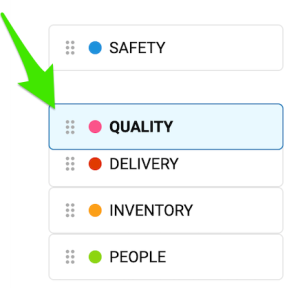
To reorder your metrics, left-click and hold a metric, drag it to the desired position and release the mouse button to drop it.
Show the trend details
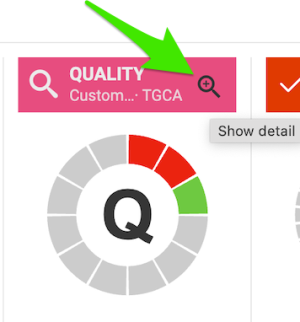
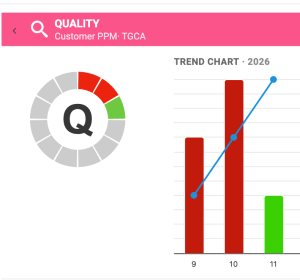
Click the magnifying glass to show the trend details. It is available only if you have more than one metric selected in the chart.
Enjoy clear charts
Enjoy clear, easy-to-read charts that give you instant visibility into your metric performance.
Still need help?
Write to us. We usually reply within an hour on business days.