Grafy SQDIP
Strojový preklad z angličtiny. Zobrazený je anglický originál.
Use SQDIP charts as a visual tool to track performance in Safety, Quality, Delivery, Inventory and Productivity. They give your team a clear, real-time view of how operations are performing against targets, and each category highlights where issues or improvements may be needed. By presenting data in a simple, structured format, SQDIP charts help your team react quickly and stay aligned on priorities.
Key features
- Clear visual of a letter / period grid and a trend chart linked to each metric
- Lists all actions tied to the metric from the dashboard for a specific metric / org. unit / time period
- Built with any metric or object
- Customizable titles, colors and icons
- Can reference related RCCA and/or 8D
- Easy to move and reorder the metrics
- Charts show actual, plan and forecast values and different time intervals
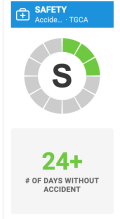
- Shows the number of periods without an unachieved objective (e.g. # of days without incident)
- Add a new action directly from your widget
Create the SQDIP widget
-
Open the slide in edit mode. Go to your report slide and click Click to edit.
-
Add the SQDIP widget. Click Add Widget and select the Metric widget (SQDIP).


-
Customize the widget. The widget settings window pops up and you are ready to customize its design.
Customize the widget
-
Show the block title. Enable Show Block Title if you want to display a title. Then choose the title text, font size, color and icon.

-
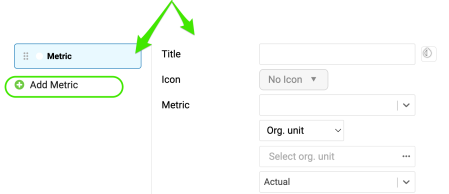
Add metrics. A default metric is displayed. You can start configuring it by adding the details you need. To add more metrics, click the Add Metric button and define them as well.
Define the metric settings
Choose the metric basics
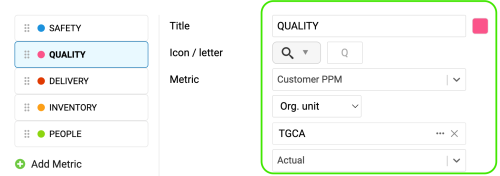
Choose the title, color, icon, metric, org. unit and type interval (actual data, last, next).
Set the time intervals
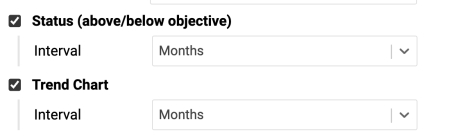
Select your metric time interval and the trend chart interval (e.g. daily, weekly, monthly data).
Count periods without an unachieved objective
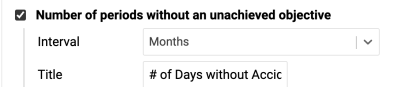
Number of periods without an unachieved objective: choose the interval and the title, e.g. “# of Days without Accident”.
Display single values
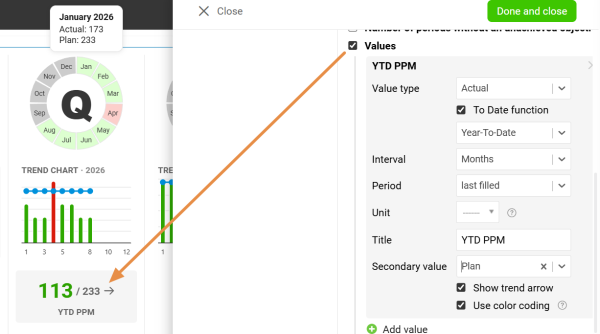
Values: display a single metric value for the selected time period.
Display all open actions
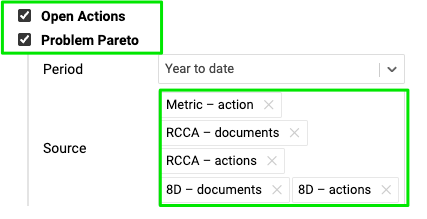
Display all open actions for the combination of your metric / org. unit.
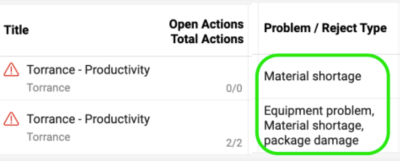
Include the Problem Pareto
Include the Problem Pareto when needed, based on the applicable source documents.
The Problem Pareto displays the number of occurrences of each problem / reject type for the selected org. unit / metric combination. It also displays the cumulative percentage, showing the share of each problem in the total number of occurrences.

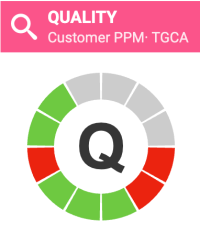
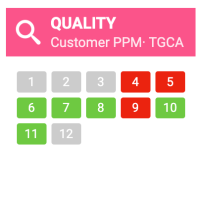
Choose the status visualization
Choose the Status Visualization: Letter in circle or Period grid.

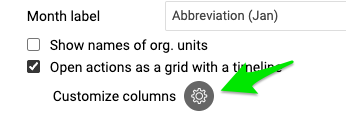
Show open actions on a timeline
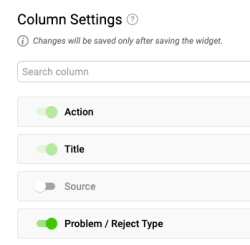
Display open actions as a grid with a timeline and Customize columns.

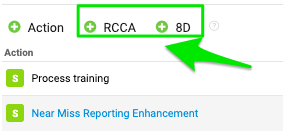
Add RCCA and 8D actions
You also have options to show actions from RCCA and 8D documents and to show weekdays only. If you choose to show actions from RCCA and 8D, you can also initiate an RCCA or 8D directly from your slide.

Resize the widget and finish
Adjust the size of your widget and click the Done and close button.


Additional features
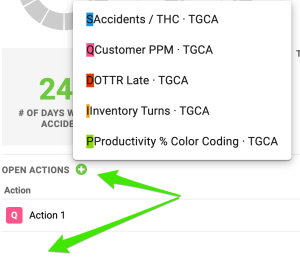
Add actions from the widget
Add new actions directly from your widget: click Add action +, choose the combination and define the action settings.
Reorder the metrics
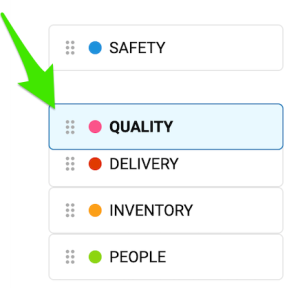
To reorder your metrics, left-click and hold a metric, drag it to the desired position and release the mouse button to drop it.
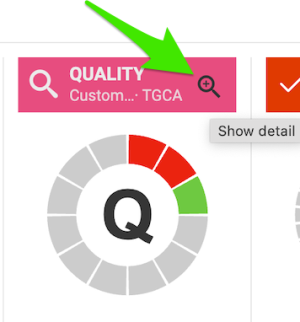
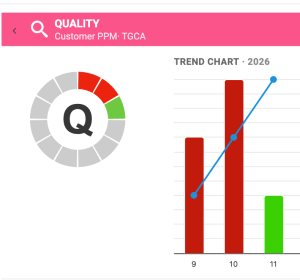
Show the trend details
Click the magnifying glass to show the trend details. It is available only if you have more than one metric selected in the chart.
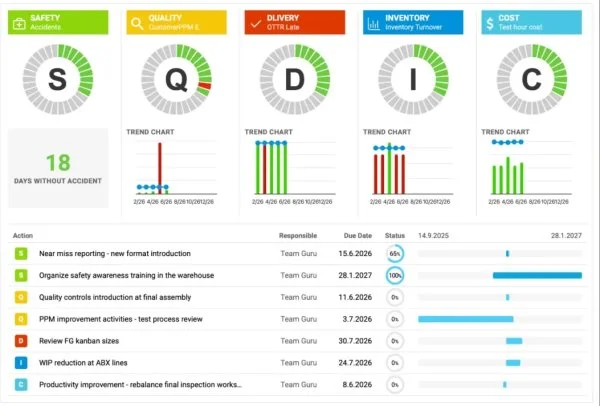
Enjoy clear charts
Enjoy clear, easy-to-read charts that give you instant visibility into your metric performance.
Grafy SQDIP používajte ako vizuálny nástroj na sledovanie výkonnosti v oblastiach bezpečnosť, kvalita, dodávky, zásoby a produktivita. Tím v nich jasne a v reálnom čase vidí, ako si prevádzka vedie v porovnaní s cieľmi, a každá kategória ukazuje, kde sú problémy alebo kde treba niečo zlepšiť. Keďže sú údaje podané jednoducho a prehľadne, grafy SQDIP pomáhajú tímu rýchlo reagovať a držať sa spoločných priorít.
Hlavné funkcie
- Prehľadné zobrazenie písmena / mriežky období a graf trendu prepojený s každou metrikou
- Zoznam všetkých akcií naviazaných na metriku z dashboardu pre konkrétnu metriku / org. jednotku / obdobie
- Možnosť vytvoriť s akoukoľvek metrikou alebo objektom
- Prispôsobiteľné názvy, farby a ikony
- Možnosť odkázať na súvisiace RCCA a/alebo 8D
- Jednoduchý presun a zmena poradia metrík
- Grafy zobrazujú skutočné, plánované a predpovedané hodnoty a rôzne časové intervaly
- Zobrazenie počtu období bez nesplneného cieľa (napr. počet dní bez incidentu)
- Pridanie novej akcie priamo z widgetu
Vytvorte widget SQDIP
-
Otvorte snímku v režime úprav. Prejdite na snímku reportu a kliknite na Kliknutím upravte.
-
Pridajte widget SQDIP. Kliknite na Pridať widget a vyberte Widget metriky (SQDIP).
-
Prispôsobte widget. Otvorí sa okno s nastaveniami widgetu a môžete začať upravovať jeho vzhľad.
Prispôsobte widget
-
Zobrazte názov bloku. Ak chcete zobraziť názov, zapnite Zobraziť názov bloku. Potom zvoľte text názvu, veľkosť písma, farbu a ikonu.
-
Pridajte metriky. Zobrazí sa predvolená metrika. Nastavíte ju doplnením potrebných údajov. Ďalšie metriky pridáte tlačidlom Pridať metriku a nastavíte ich rovnako.
Nastavte metriku
Zvoľte základné údaje metriky
Zvoľte názov, farbu, ikonu, metriku, org. jednotku a typ intervalu (skutočné údaje, predchádzajúci, nasledujúci).
Nastavte časové intervaly
Vyberte časový interval metriky a interval grafu trendu (napr. denné, týždenné, mesačné údaje).
Počítajte obdobia bez nesplneného cieľa
Počet období bez nesplneného cieľa: zvoľte interval a názov, napr. „Počet dní bez úrazu“.
Zobrazte jednotlivé hodnoty
Hodnoty: zobrazí jednu hodnotu metriky za vybrané obdobie.
Zobrazte všetky otvorené akcie
Zobraziť všetky otvorené akcie pre kombináciu metriky / org. jednotky.
Zahrňte Pareto problémov
V prípade potreby zahrňte Pareto problémov na základe príslušných zdrojových dokumentov.
Pareto problémov zobrazuje počet výskytov každého typu problému / nepodarku pre vybranú kombináciu org. jednotky / metriky. Zobrazuje aj kumulatívne percento, teda podiel každého problému na celkovom počte výskytov.
Zvoľte zobrazenie stavu
Zvoľte Zobrazenie stavu: Písmeno v kruhu alebo Mriežka období.
Zobrazte otvorené akcie na časovej osi
Zobrazte otvorené akcie ako mriežku s časovou osou a Prispôsobte stĺpce.
Pridajte akcie z RCCA a 8D
Môžete tiež zobraziť akcie z dokumentov RCCA a 8D a zobrazovať len pracovné dni. Ak zvolíte zobrazenie akcií z RCCA a 8D, môžete RCCA alebo 8D spustiť aj priamo zo snímky.
Zmeňte veľkosť widgetu a dokončite
Upravte veľkosť widgetu a kliknite na tlačidlo Hotovo a zavrieť.
Ďalšie funkcie
Pridávajte akcie z widgetu
Nové akcie pridáte priamo z widgetu: kliknite na Pridať akciu +, zvoľte kombináciu a nastavte akciu.
Zmeňte poradie metrík
Poradie metrík zmeníte tak, že metriku chytíte ľavým tlačidlom myši, presuniete ju na požadované miesto a tlačidlo pustíte.
Zobrazte podrobnosti trendu
Podrobnosti trendu zobrazíte kliknutím na lupu. Je dostupná len vtedy, ak máte v grafe vybranú viac ako jednu metriku.
Prehľadné grafy
Získajte prehľadné a ľahko čitateľné grafy, ktoré vám okamžite ukážu výkonnosť vašich metrík.
Potrebujete ďalšiu pomoc?
Napíšte nám. V pracovné dni zvyčajne odpovedáme do hodiny.