SQDIP图表
本文由英文机器翻译。 当前显示英文原文。
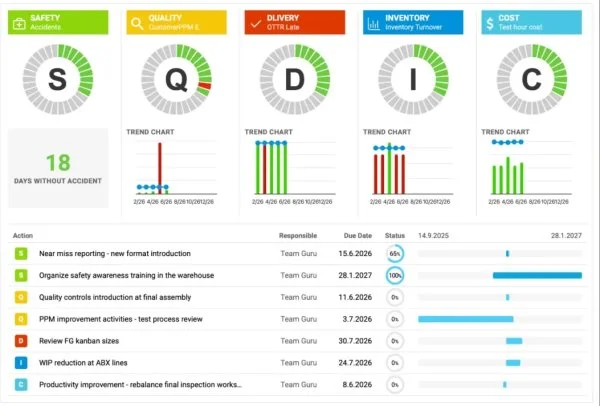
Use SQDIP charts as a visual tool to track performance in Safety, Quality, Delivery, Inventory and Productivity. They give your team a clear, real-time view of how operations are performing against targets, and each category highlights where issues or improvements may be needed. By presenting data in a simple, structured format, SQDIP charts help your team react quickly and stay aligned on priorities.
Key features
- Clear visual of a letter / period grid and a trend chart linked to each metric
- Lists all actions tied to the metric from the dashboard for a specific metric / org. unit / time period
- Built with any metric or object
- Customizable titles, colors and icons
- Can reference related RCCA and/or 8D
- Easy to move and reorder the metrics
- Charts show actual, plan and forecast values and different time intervals
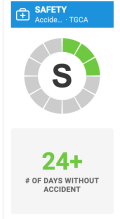
- Shows the number of periods without an unachieved objective (e.g. # of days without incident)
- Add a new action directly from your widget
Create the SQDIP widget
-
Open the slide in edit mode. Go to your report slide and click Click to edit.
-
Add the SQDIP widget. Click Add Widget and select the Metric widget (SQDIP).


-
Customize the widget. The widget settings window pops up and you are ready to customize its design.
Customize the widget
-
Show the block title. Enable Show Block Title if you want to display a title. Then choose the title text, font size, color and icon.

-
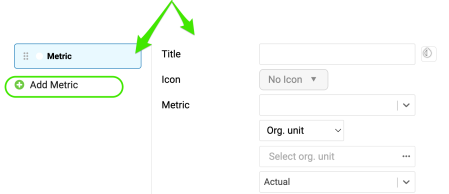
Add metrics. A default metric is displayed. You can start configuring it by adding the details you need. To add more metrics, click the Add Metric button and define them as well.
Define the metric settings
Choose the metric basics
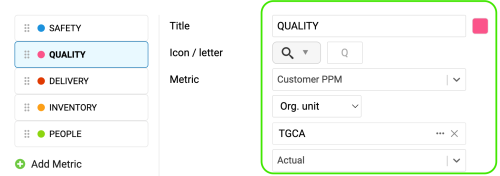
Choose the title, color, icon, metric, org. unit and type interval (actual data, last, next).
Set the time intervals
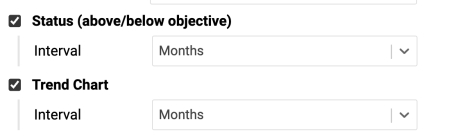
Select your metric time interval and the trend chart interval (e.g. daily, weekly, monthly data).
Count periods without an unachieved objective
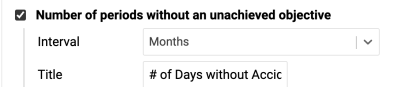
Number of periods without an unachieved objective: choose the interval and the title, e.g. “# of Days without Accident”.
Display single values
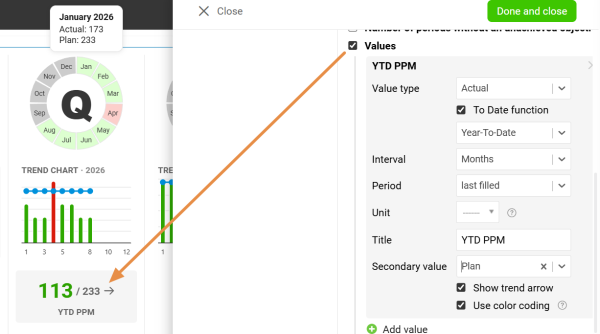
Values: display a single metric value for the selected time period.
Display all open actions
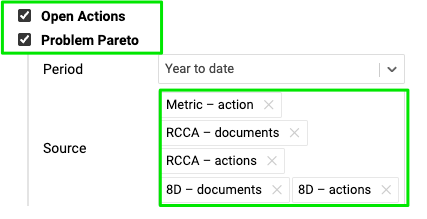
Display all open actions for the combination of your metric / org. unit.
Include the Problem Pareto
Include the Problem Pareto when needed, based on the applicable source documents.
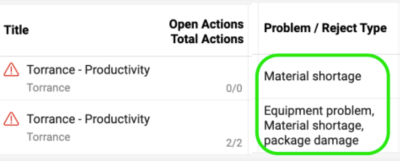
The Problem Pareto displays the number of occurrences of each problem / reject type for the selected org. unit / metric combination. It also displays the cumulative percentage, showing the share of each problem in the total number of occurrences.

Choose the status visualization
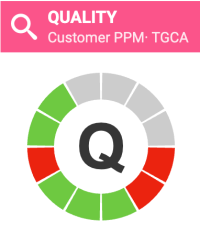
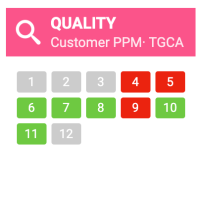
Choose the Status Visualization: Letter in circle or Period grid.

Show open actions on a timeline
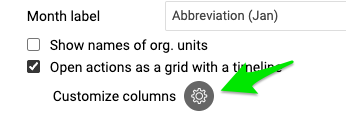
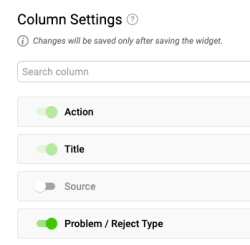
Display open actions as a grid with a timeline and Customize columns.

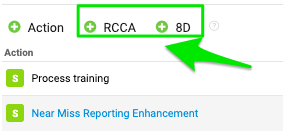
Add RCCA and 8D actions
You also have options to show actions from RCCA and 8D documents and to show weekdays only. If you choose to show actions from RCCA and 8D, you can also initiate an RCCA or 8D directly from your slide.

Resize the widget and finish
Adjust the size of your widget and click the Done and close button.


Additional features
Add actions from the widget
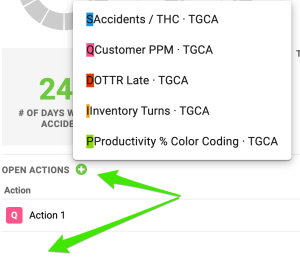
Add new actions directly from your widget: click Add action +, choose the combination and define the action settings.
Reorder the metrics
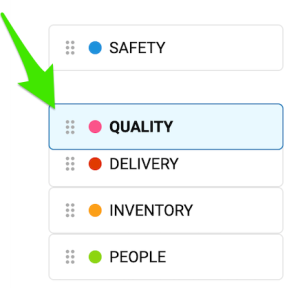
To reorder your metrics, left-click and hold a metric, drag it to the desired position and release the mouse button to drop it.
Show the trend details
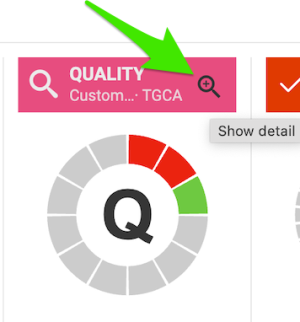
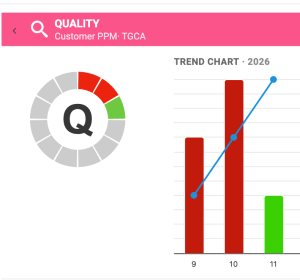
Click the magnifying glass to show the trend details. It is available only if you have more than one metric selected in the chart.
Enjoy clear charts
Enjoy clear, easy-to-read charts that give you instant visibility into your metric performance.
SQDIP图表是一种直观跟踪安全、质量、交付、库存和生产率绩效的可视化工具。它让团队清楚、实时地了解运营相对于目标的表现,每个类别都会突出显示可能需要处理问题或改进的地方。通过简单、结构化的方式呈现数据,SQDIP图表可帮助团队快速响应,并在优先事项上保持一致。
主要功能
- 清晰直观的字母/周期网格,以及与每个指标关联的趋势图
- 列出仪表板中与特定指标/组织单元/时间段相关的所有行动
- 可基于任意指标或对象创建
- 标题、颜色和图标均可自定义
- 可引用相关的RCCA和/或8D
- 轻松移动指标并调整顺序
- 图表显示实际值、计划值和预测值,以及不同的时间间隔
- 显示未出现目标未达成的连续周期数(例如无事故天数)
- 直接在组件中添加新行动
创建SQDIP组件
-
以编辑模式打开幻灯片。 进入报告幻灯片,点击点击编辑。
-
添加SQDIP组件。 点击添加组件,选择指标组件(SQDIP)。
-
自定义组件。 系统会弹出组件设置窗口,您可以开始自定义其设计。
自定义组件
-
显示区块标题。 如果要显示标题,请启用显示区块标题。然后选择标题文字、字号、颜色和图标。
-
添加指标。 组件中会显示一个默认指标。您可以添加所需的详细信息,开始配置该指标。要添加更多指标,请点击添加指标按钮,并同样进行定义。
定义指标设置
选择指标基本信息
选择标题、颜色、图标、指标、组织单元和区间类型(实际数据、上一期、下一期)。
设置时间间隔
选择指标时间间隔和趋势图间隔(例如每日、每周、每月数据)。
统计未出现目标未达成的周期数
未出现目标未达成的周期数:选择间隔和标题,例如“无事故天数”。
显示单个数值
数值:显示所选时间段的单个指标数值。
显示所有未完成的行动
显示所有未完成的行动,针对指标/组织单元的组合。
包含问题Pareto图
如有需要,可根据适用的来源文档包含问题Pareto图。
问题Pareto图显示所选组织单元/指标组合中每种问题/不良类型的发生次数。它还会显示累计百分比,即每个问题在总发生次数中所占的比例。
选择状态可视化方式
选择状态可视化:圆圈字母或周期网格。
在时间线上显示未完成的行动
将未完成的行动显示为带时间线的网格,并自定义列。
添加RCCA和8D行动
您还可以选择显示来自RCCA和8D文档的行动,以及仅显示工作日。如果选择显示来自RCCA和8D的行动,还可以直接从幻灯片发起RCCA或8D。
调整组件大小并完成
调整组件的大小,然后点击完成并关闭按钮。
其他功能
从组件中添加行动
直接在组件中添加新行动:点击添加行动 +,选择组合并定义行动设置。
调整指标顺序
要调整指标顺序,请用鼠标左键按住某个指标,将其拖到目标位置后松开鼠标按钮即可。
显示趋势详细信息
点击放大镜可显示趋势详细信息。仅当图表中选择了多个指标时,此功能才可用。
享受清晰的图表
清晰易读的图表让您即时掌握指标表现。
还需要帮助吗?
请给我们留言。工作日我们通常会在一小时内回复。