Gráficos SQDIP
Traducción automática del inglés. Se muestra el original en inglés.
Use SQDIP charts as a visual tool to track performance in Safety, Quality, Delivery, Inventory and Productivity. They give your team a clear, real-time view of how operations are performing against targets, and each category highlights where issues or improvements may be needed. By presenting data in a simple, structured format, SQDIP charts help your team react quickly and stay aligned on priorities.
Key features
- Clear visual of a letter / period grid and a trend chart linked to each metric
- Lists all actions tied to the metric from the dashboard for a specific metric / org. unit / time period
- Built with any metric or object
- Customizable titles, colors and icons
- Can reference related RCCA and/or 8D
- Easy to move and reorder the metrics
- Charts show actual, plan and forecast values and different time intervals
- Shows the number of periods without an unachieved objective (e.g. # of days without incident)
- Add a new action directly from your widget
Create the SQDIP widget
-
Open the slide in edit mode. Go to your report slide and click Click to edit.
-
Add the SQDIP widget. Click Add Widget and select the Metric widget (SQDIP).

-
Customize the widget. The widget settings window pops up and you are ready to customize its design.
Customize the widget
-
Show the block title. Enable Show Block Title if you want to display a title. Then choose the title text, font size, color and icon.

-
Add metrics. A default metric is displayed. You can start configuring it by adding the details you need. To add more metrics, click the Add Metric button and define them as well.
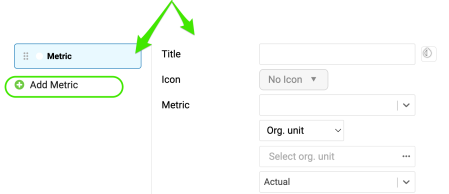
Define the metric settings
Choose the metric basics
Choose the title, color, icon, metric, org. unit and type interval (actual data, last, next).
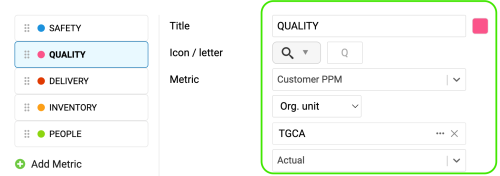
Set the time intervals
Select your metric time interval and the trend chart interval (e.g. daily, weekly, monthly data).
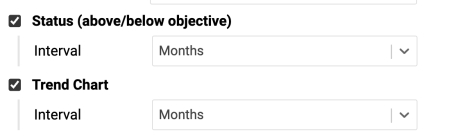
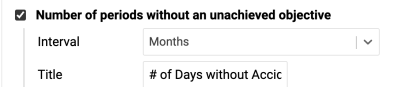
Count periods without an unachieved objective
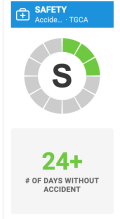
Number of periods without an unachieved objective: choose the interval and the title, e.g. “# of Days without Accident”.
Display single values
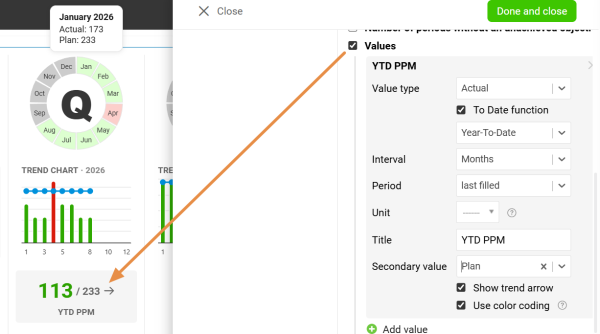
Values: display a single metric value for the selected time period.
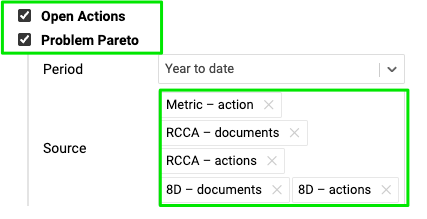
Display all open actions
Display all open actions for the combination of your metric / org. unit.
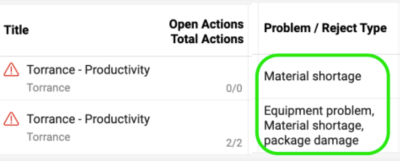
Include the Problem Pareto
Include the Problem Pareto when needed, based on the applicable source documents.
The Problem Pareto displays the number of occurrences of each problem / reject type for the selected org. unit / metric combination. It also displays the cumulative percentage, showing the share of each problem in the total number of occurrences.

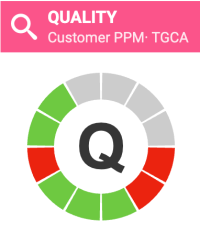
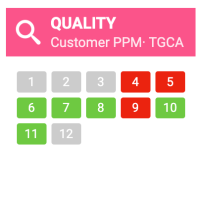
Choose the status visualization
Choose the Status Visualization: Letter in circle or Period grid.

Show open actions on a timeline
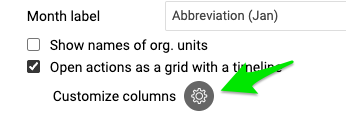
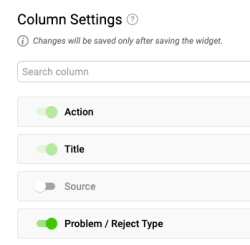
Display open actions as a grid with a timeline and Customize columns.

Add RCCA and 8D actions
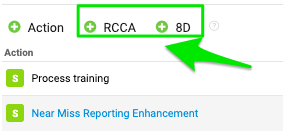
You also have options to show actions from RCCA and 8D documents and to show weekdays only. If you choose to show actions from RCCA and 8D, you can also initiate an RCCA or 8D directly from your slide.

Resize the widget and finish
Adjust the size of your widget and click the Done and close button.

Additional features
Add actions from the widget
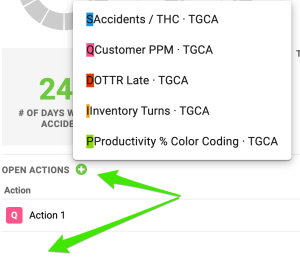
Add new actions directly from your widget: click Add action +, choose the combination and define the action settings.
Reorder the metrics
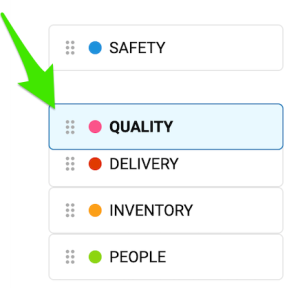
To reorder your metrics, left-click and hold a metric, drag it to the desired position and release the mouse button to drop it.
Show the trend details
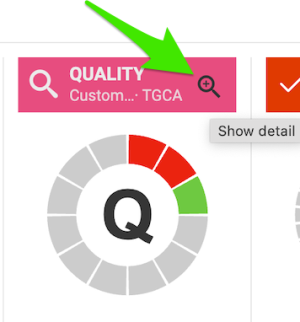
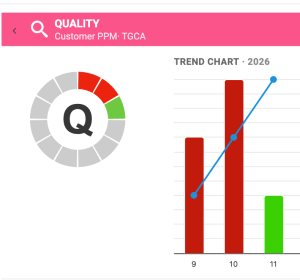
Click the magnifying glass to show the trend details. It is available only if you have more than one metric selected in the chart.
Enjoy clear charts
Enjoy clear, easy-to-read charts that give you instant visibility into your metric performance.
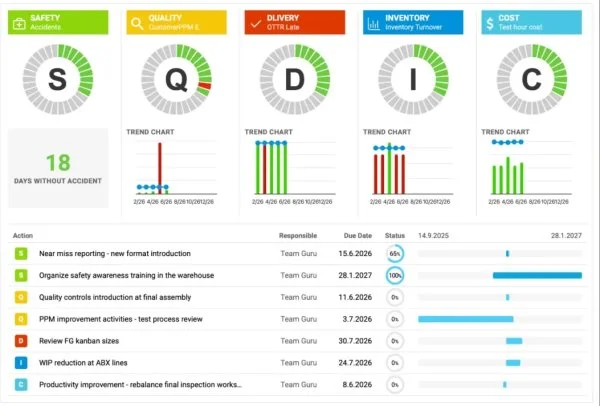
Use los gráficos SQDIP como herramienta visual para seguir el desempeño en Seguridad, Calidad, Entrega, Inventario y Productividad. Ofrecen a su equipo una visión clara y en tiempo real de cómo rinden las operaciones frente a los objetivos, y cada categoría señala dónde puede haber problemas o hacer falta mejorar. Al presentar los datos de forma sencilla y estructurada, los gráficos SQDIP ayudan a su equipo a reaccionar rápido y a mantenerse alineado en las prioridades.
Funciones clave
- Vista clara con una letra o una cuadrícula de periodos y un gráfico de tendencia vinculado a cada métrica
- Lista todas las acciones vinculadas a la métrica desde el dashboard para una métrica, unidad organizativa o periodo concretos
- Se crea con cualquier métrica u objeto
- Títulos, colores e iconos personalizables
- Puede hacer referencia a los RCCA o 8D relacionados
- Las métricas se mueven y reordenan fácilmente
- Los gráficos muestran valores reales, planificados y pronosticados, con distintos intervalos de tiempo
- Muestra el número de periodos sin un objetivo incumplido (por ejemplo, n.º de días sin incidentes)
- Agregue una acción nueva directamente desde el widget
Crear el widget SQDIP
-
Abra la diapositiva en modo de edición. Vaya a la diapositiva de su informe y haga clic en Clic para editar.
-
Agregue el widget SQDIP. Haga clic en Agregar widget y seleccione Widget de métricas (SQDIP).
-
Personalice el widget. Se abre la ventana de configuración del widget y ya puede personalizar su diseño.
Personalizar el widget
-
Muestre el título del bloque. Active Mostrar título del bloque si quiere mostrar un título. Después, elija el texto, el tamaño de letra, el color y el icono del título.
-
Agregue métricas. Se muestra una métrica predeterminada. Puede empezar a configurarla agregando los detalles que necesite. Para agregar más métricas, haga clic en el botón Agregar métrica y defínalas también.
Definir la configuración de la métrica
Elegir los datos básicos de la métrica
Elija el título, el color, el icono, la métrica, la unidad organizativa y el tipo de intervalo (datos actuales, último, siguiente).
Definir los intervalos de tiempo
Seleccione el intervalo de tiempo de la métrica y el del gráfico de tendencia (por ejemplo, datos diarios, semanales, mensuales).
Contar los periodos sin un objetivo incumplido
Número de periodos sin un objetivo incumplido: elija el intervalo y el título, por ejemplo, “N.º de días sin accidentes”.
Mostrar valores individuales
Valores: muestre un único valor de la métrica para el periodo seleccionado.
Mostrar todas las acciones abiertas
Muestre todas las acciones abiertas de la combinación de métrica y unidad organizativa.
Incluir el Pareto de problemas
Incluya el Pareto de problemas cuando lo necesite, a partir de los documentos de origen correspondientes.
El Pareto de problemas muestra el número de ocurrencias de cada tipo de problema o de rechazo para la combinación de unidad organizativa y métrica seleccionada. También muestra el porcentaje acumulado, es decir, la proporción de cada problema sobre el total de ocurrencias.
Elegir la visualización del estado
Elija la Visualización del estado: Letra en círculo o Cuadrícula de periodos.
Mostrar las acciones abiertas en una línea de tiempo
Muestre las acciones abiertas como cuadrícula con línea de tiempo y use Personalizar columnas.
Agregar acciones de RCCA y 8D
También puede mostrar acciones de documentos RCCA y 8D y mostrar solo días laborables. Si elige mostrar las acciones de RCCA y 8D, también puede iniciar un RCCA o un 8D directamente desde la diapositiva.
Ajustar el tamaño del widget y terminar
Ajuste el tamaño del widget y haga clic en el botón Listo y cerrar.
Funciones adicionales
Agregar acciones desde el widget
Agregue acciones nuevas directamente desde el widget: haga clic en Agregar acción +, elija la combinación y defina la configuración de la acción.
Reordenar las métricas
Para reordenar sus métricas, haga clic con el botón izquierdo sobre una métrica y manténgalo pulsado, arrástrela a la posición deseada y suelte el botón del mouse.
Mostrar los detalles de la tendencia
Haga clic en la lupa para mostrar los detalles de la tendencia. Solo está disponible si tiene más de una métrica seleccionada en el gráfico.
Disfrutar de gráficos claros
Disfrute de gráficos claros y fáciles de leer que le muestran al instante el desempeño de sus métricas.
¿Necesita más ayuda?
Escríbanos. En días laborables solemos responder en menos de una hora.