Wykresy SQDIP
Tłumaczenie maszynowe z angielskiego. Wyświetlany jest oryginał po angielsku.
Use SQDIP charts as a visual tool to track performance in Safety, Quality, Delivery, Inventory and Productivity. They give your team a clear, real-time view of how operations are performing against targets, and each category highlights where issues or improvements may be needed. By presenting data in a simple, structured format, SQDIP charts help your team react quickly and stay aligned on priorities.
Key features
- Clear visual of a letter / period grid and a trend chart linked to each metric
- Lists all actions tied to the metric from the dashboard for a specific metric / org. unit / time period
- Built with any metric or object
- Customizable titles, colors and icons
- Can reference related RCCA and/or 8D
- Easy to move and reorder the metrics
- Charts show actual, plan and forecast values and different time intervals
- Shows the number of periods without an unachieved objective (e.g. # of days without incident)
- Add a new action directly from your widget
Create the SQDIP widget
-
Open the slide in edit mode. Go to your report slide and click Click to edit.
-
Add the SQDIP widget. Click Add Widget and select the Metric widget (SQDIP).

-
Customize the widget. The widget settings window pops up and you are ready to customize its design.
Customize the widget
-
Show the block title. Enable Show Block Title if you want to display a title. Then choose the title text, font size, color and icon.

-
Add metrics. A default metric is displayed. You can start configuring it by adding the details you need. To add more metrics, click the Add Metric button and define them as well.
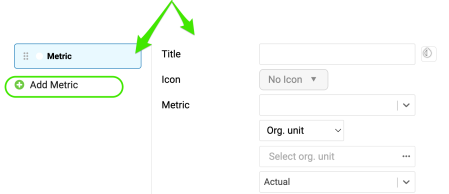
Define the metric settings
Choose the metric basics
Choose the title, color, icon, metric, org. unit and type interval (actual data, last, next).
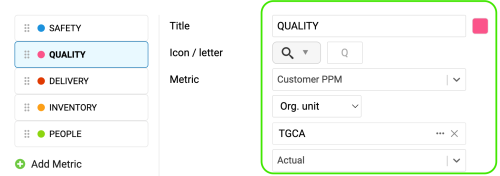
Set the time intervals
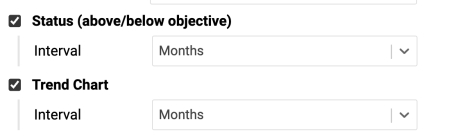
Select your metric time interval and the trend chart interval (e.g. daily, weekly, monthly data).
Count periods without an unachieved objective
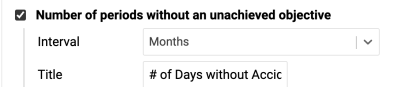
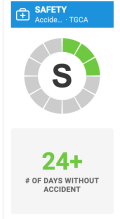
Number of periods without an unachieved objective: choose the interval and the title, e.g. “# of Days without Accident”.
Display single values
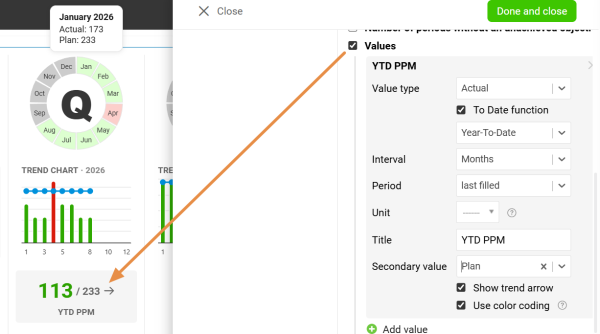
Values: display a single metric value for the selected time period.
Display all open actions
Display all open actions for the combination of your metric / org. unit.
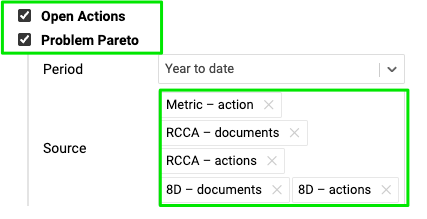
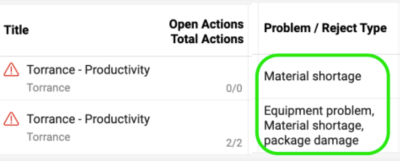
Include the Problem Pareto
Include the Problem Pareto when needed, based on the applicable source documents.
The Problem Pareto displays the number of occurrences of each problem / reject type for the selected org. unit / metric combination. It also displays the cumulative percentage, showing the share of each problem in the total number of occurrences.

Choose the status visualization
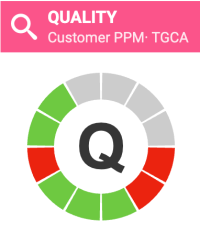
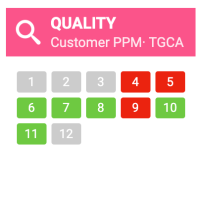
Choose the Status Visualization: Letter in circle or Period grid.

Show open actions on a timeline
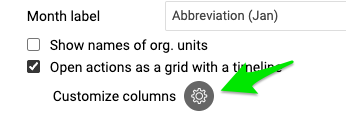
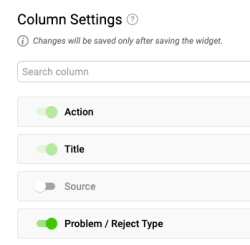
Display open actions as a grid with a timeline and Customize columns.

Add RCCA and 8D actions
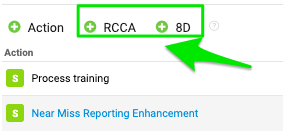
You also have options to show actions from RCCA and 8D documents and to show weekdays only. If you choose to show actions from RCCA and 8D, you can also initiate an RCCA or 8D directly from your slide.

Resize the widget and finish
Adjust the size of your widget and click the Done and close button.

Additional features
Add actions from the widget
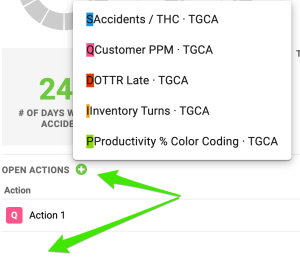
Add new actions directly from your widget: click Add action +, choose the combination and define the action settings.
Reorder the metrics
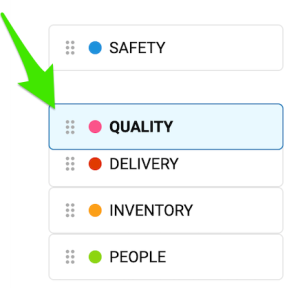
To reorder your metrics, left-click and hold a metric, drag it to the desired position and release the mouse button to drop it.
Show the trend details
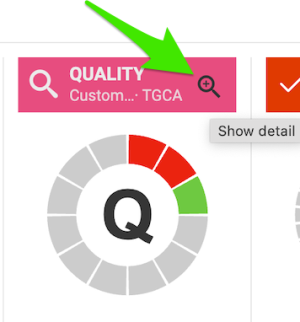
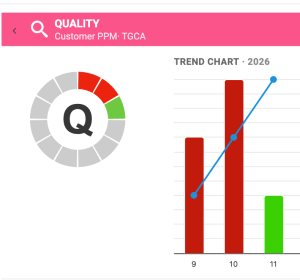
Click the magnifying glass to show the trend details. It is available only if you have more than one metric selected in the chart.
Enjoy clear charts
Enjoy clear, easy-to-read charts that give you instant visibility into your metric performance.
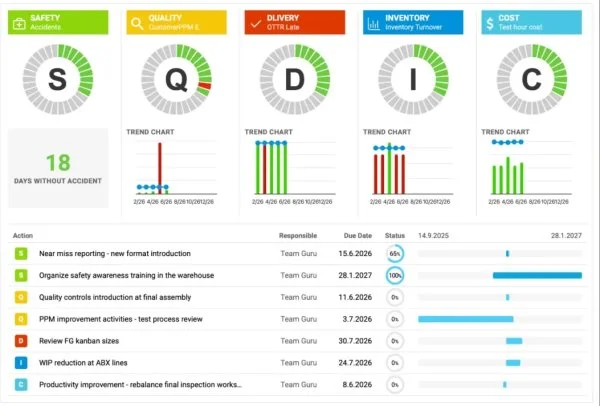
Używaj wykresów SQDIP jako wizualnego narzędzia do śledzenia wyników w obszarach bezpieczeństwa, jakości, terminowości dostaw, zapasów i produktywności. Zespół widzi na bieżąco, jak procesy wypadają na tle celów, a każda kategoria pokazuje, gdzie mogą być potrzebne interwencje lub usprawnienia. Dane są przedstawione w prostej, uporządkowanej formie, więc wykresy SQDIP pomagają zespołowi szybko reagować i trzymać się wspólnych priorytetów.
Najważniejsze funkcje
- Czytelna litera lub siatka okresów oraz wykres trendu dla każdego wskaźnika
- Lista wszystkich działań powiązanych ze wskaźnikiem z dashboardu dla wybranego wskaźnika, jednostki organizacyjnej i okresu
- Tworzenie z dowolnym wskaźnikiem lub obiektem
- Konfigurowalne tytuły, kolory i ikony
- Możliwość powiązania z dokumentami RCCA lub 8D
- Łatwe przenoszenie wskaźników i zmiana ich kolejności
- Wykresy z wartościami rzeczywistymi, planowanymi i prognozowanymi oraz różnymi interwałami czasowymi
- Liczba okresów bez nieosiągniętego celu (np. liczba dni bez incydentu)
- Dodawanie nowego działania bezpośrednio z widżetu
Utwórz widżet SQDIP
-
Otwórz slajd w trybie edycji. Przejdź do slajdu raportu i kliknij Kliknij, aby edytować.
-
Dodaj widżet SQDIP. Kliknij Dodaj widżet i wybierz Widżet wskaźnika (SQDIP).
-
Dostosuj widżet. Otworzy się okno ustawień widżetu, w którym możesz dostosować jego wygląd.
Dostosuj widżet
-
Pokaż tytuł bloku. Włącz Pokaż tytuł bloku, jeśli chcesz wyświetlać tytuł. Następnie wybierz tekst tytułu, rozmiar czcionki, kolor i ikonę.
-
Dodaj wskaźniki. Widżet pokazuje wskaźnik domyślny. Możesz zacząć go konfigurować, dodając potrzebne szczegóły. Aby dodać kolejne wskaźniki, kliknij przycisk Dodaj wskaźnik i je również zdefiniuj.
Określ ustawienia wskaźnika
Wybierz podstawowe ustawienia wskaźnika
Wybierz tytuł, kolor, ikonę, wskaźnik, jednostkę organizacyjną i typ interwału (dane bieżące, poprzedni, następny).
Ustaw interwały czasowe
Wybierz interwał czasowy wskaźnika i interwał wykresu trendu (np. dane dzienne, tygodniowe, miesięczne).
Licz okresy bez nieosiągniętego celu
Liczba okresów bez nieosiągniętego celu: wybierz interwał i tytuł, np. „Liczba dni bez wypadku”.
Wyświetlaj pojedyncze wartości
Wartości: wyświetlaj pojedynczą wartość wskaźnika dla wybranego okresu.
Wyświetlaj wszystkie otwarte działania
Wyświetlaj wszystkie otwarte działania dla danej kombinacji wskaźnika i jednostki organizacyjnej.
Dodaj Pareto problemów
W razie potrzeby dodaj Pareto problemów na podstawie odpowiednich dokumentów źródłowych.
Pareto problemów pokazuje liczbę wystąpień każdego problemu lub typu braku dla wybranej kombinacji jednostki organizacyjnej i wskaźnika. Pokazuje też procent skumulowany, czyli udział każdego problemu w łącznej liczbie wystąpień.
Wybierz wizualizację statusu
Wybierz Wizualizację statusu: Litera w kółku lub Siatka okresów.
Pokaż otwarte działania na osi czasu
Wyświetlaj otwarte działania jako siatkę z osią czasu i użyj opcji Dostosuj kolumny.
Dodaj działania z RCCA i 8D
Możesz też pokazywać działania z dokumentów RCCA i 8D oraz wyświetlać tylko dni robocze. Jeśli włączysz działania z RCCA i 8D, możesz też rozpocząć RCCA lub 8D bezpośrednio ze slajdu.
Zmień rozmiar widżetu i zakończ
Dopasuj rozmiar widżetu i kliknij przycisk Gotowe i zamknij.
Dodatkowe funkcje
Dodawaj działania z widżetu
Dodawaj nowe działania bezpośrednio z widżetu: kliknij Dodaj działanie +, wybierz kombinację i określ ustawienia działania.
Zmień kolejność wskaźników
Aby zmienić kolejność wskaźników, kliknij wskaźnik lewym przyciskiem myszy i przytrzymaj, przeciągnij go w wybrane miejsce i zwolnij przycisk.
Pokaż szczegóły trendu
Kliknij lupę, aby zobaczyć szczegóły trendu. Opcja jest dostępna tylko wtedy, gdy na wykresie wybrano więcej niż jeden wskaźnik.
Korzystaj z czytelnych wykresów
Czytelne, przejrzyste wykresy od razu pokazują, jak wypadają twoje wskaźniki.
Potrzebujesz dalszej pomocy?
Napisz do nas. W dni robocze zwykle odpowiadamy w ciągu godziny.