Jak ustawić automatyczne kolorowanie
Tłumaczenie maszynowe z angielskiego. Wyświetlany jest oryginał po angielsku.
Metric dashboard color coding can work automatically. For that, the metric type must be defined as positive (above the target) or negative (below the target).
Conditions for automatic color coding
- Actual and plan values. The metric dashboard contains both actual and plan values.
- Metric type. The metric is defined in its profile as described below.
Define the metric type
-
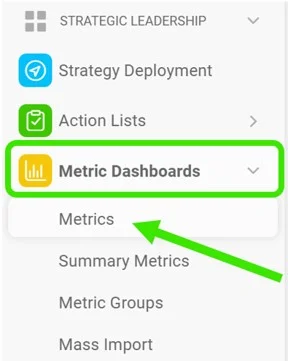
Open the metric list. Go to the Metric Dashboards module and select Metrics in the submenu.
-
Edit the metric. Click the Edit icon.

-
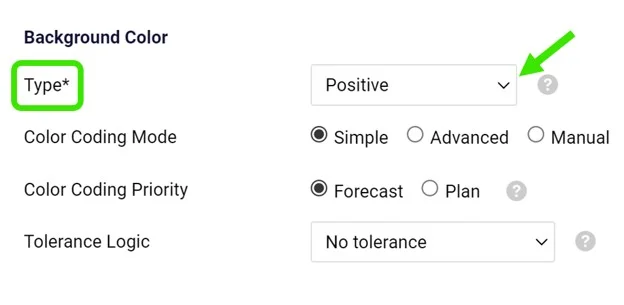
Select the metric type. Select Positive as the metric type for values that should be above the target, or Negative for values that should be below the target.
The basic color coding works with red and green. In addition, yellow (amber) can be used directly in your dashboard when the value is within the tolerance. See How to set up amber color for metrics in a dashboard.
Kolorowanie w dashboardzie KPI może działać automatycznie. W tym celu typ wskaźnika musi być określony jako pozytywny (powyżej celu) lub negatywny (poniżej celu).
Warunki automatycznego kolorowania
- Wartości rzeczywiste i planowane. Dashboard KPI zawiera zarówno wartości rzeczywiste, jak i planowane.
- Typ wskaźnika. Wskaźnik ma w swoim profilu ustawiony typ, jak opisano poniżej.
Ustaw typ wskaźnika
-
Otwórz listę wskaźników. Otwórz moduł Dashboardy KPI i w podmenu wybierz Wskaźniki.
-
Edytuj wskaźnik. Kliknij ikonę Edytuj.
-
Wybierz typ wskaźnika. Wybierz typ Pozytywny dla wartości, które powinny być powyżej celu, lub Negatywny dla wartości, które powinny być poniżej celu.
Podstawowe kolorowanie używa czerwonego i zielonego. Dodatkowo, gdy wartość mieści się w tolerancji, dashboard może pokazywać kolor żółty. Zobacz Jak ustawić żółty kolor dla wskaźników w dashboardzie.
Potrzebujesz dalszej pomocy?
Napisz do nas. W dni robocze zwykle odpowiadamy w ciągu godziny.