How to set up automatic metric dashboard
You can set up automatic metric dashboards for your org. units, projects or partners and choose other specific criteria. Once it is set up, all new projects (units) created in the system are automatically added to your metric dashboard.
You can create an automatic dashboard from all projects stored in a certain org. structure location (no special settings needed). If you want to include only certain projects in the dashboard, you can categorize them using the project type, stage, label or a custom field with a drop-down menu (described at the end of this article).
Set up an automatic metric dashboard
-
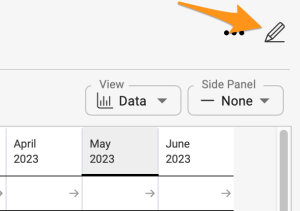
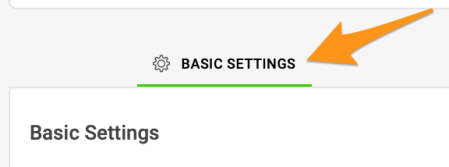
Open the dashboard settings. Go to the settings of your metric dashboard.
-
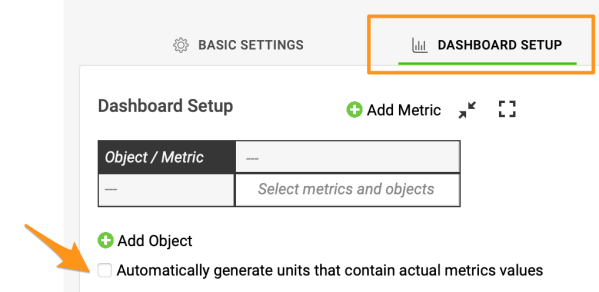
Turn on automatic generation. Scroll down to the Dashboard Setup tab and tick the Automatically generate units containing actual metric values box.
-
Select the objects and load them. Select Org. units, Projects or Partners and make the other selections based on your preference. Click the Load Objects button.
Generate a dashboard for org. units
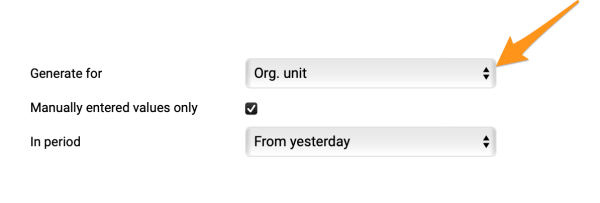
Org. units or partners are generated once you add one or more metrics to the dashboard. When you tick Manually entered values only, you get all the org. units for which a metric value is entered manually. If you untick it, you get all org. units with manually entered values and calculated values.
Generate a dashboard for projects
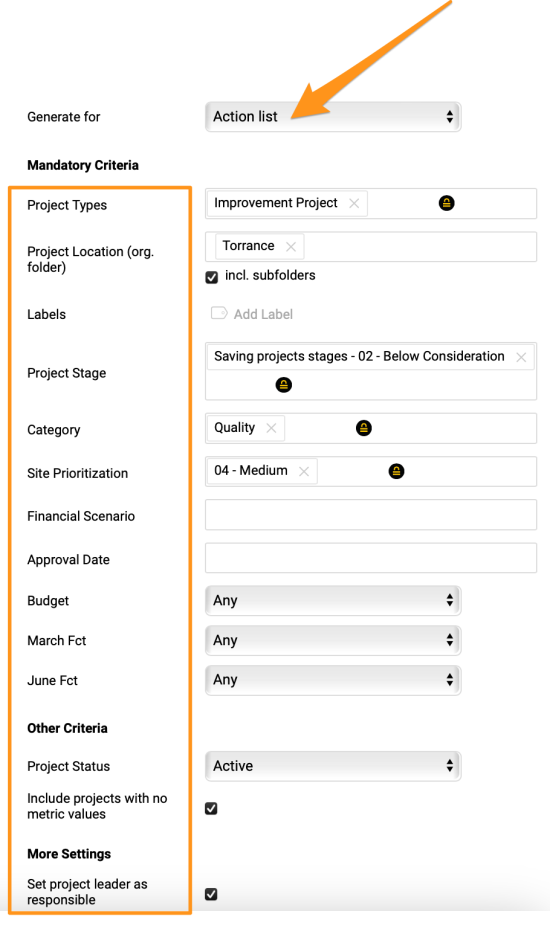
If you generate a dashboard for projects, the Include projects with no metric values box needs to be ticked. If it is not ticked, only projects that already collect values in other dashboards are generated into this dashboard. If it is ticked, you get all projects that meet the filter conditions.
Display a total for your projects
Add a simple SUM line
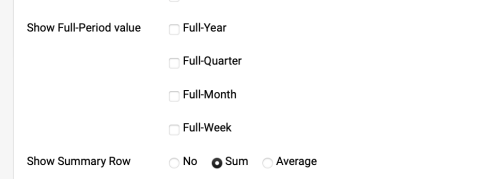
The total for your projects can be displayed in two ways. The first is a simple SUM line, for which you do not need to add any org. unit. Set it up in the default basic settings (or in the metric’s settings if the simple or advanced beta options are used).
Use org. unit summary metrics
The second way uses org. unit summary metrics: set up summary metrics for your projects or summary metrics calculated from other org. units. Then add your org. unit to the dashboard and pin it in the metric dashboard settings.
Add the org. unit
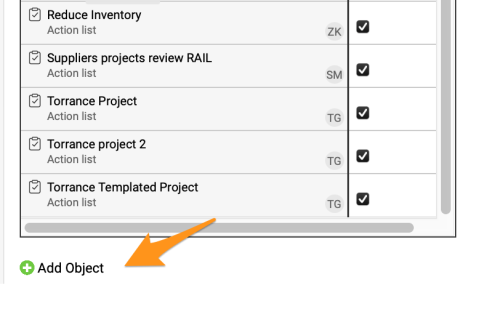
Click the green plus button to add the org. unit from the org. structure.
Pin the org. unit
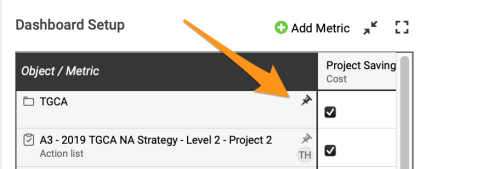
Pin your org. unit to the dashboard by clicking the pin icon.
From now on, any time a new project (org. unit, partner) is created in the system, it is automatically added to your dashboard.
To learn more, see how to set up your A3 project (action list) with the project type and project stage.
Use custom fields for automatic dashboards
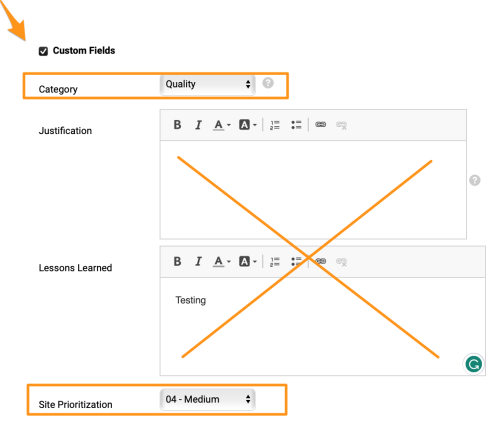
Find the custom fields of a project
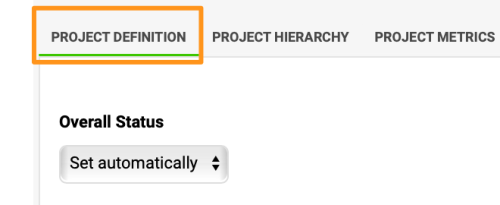
On the Project Definition tab, scroll down to find the custom fields (if any have been created). Custom fields are set up by your system administrator.
Only custom fields set up as a List box with predefined options can be used for automatic dashboards.
Related article: learn how to set up the responsible in the metric dashboard.
Still need help?
Write to us. We usually reply within an hour on business days.