Jak działa dashboard przeglądu w module Cele strategiczne
Tłumaczenie maszynowe z angielskiego. Wyświetlany jest oryginał po angielsku.
Every Strategy Deployment plan opens as a review dashboard: the X-matrix and everything you need for a strategy review – overall status, KPIs, projects and responsible people – on one page.
What you see on the page
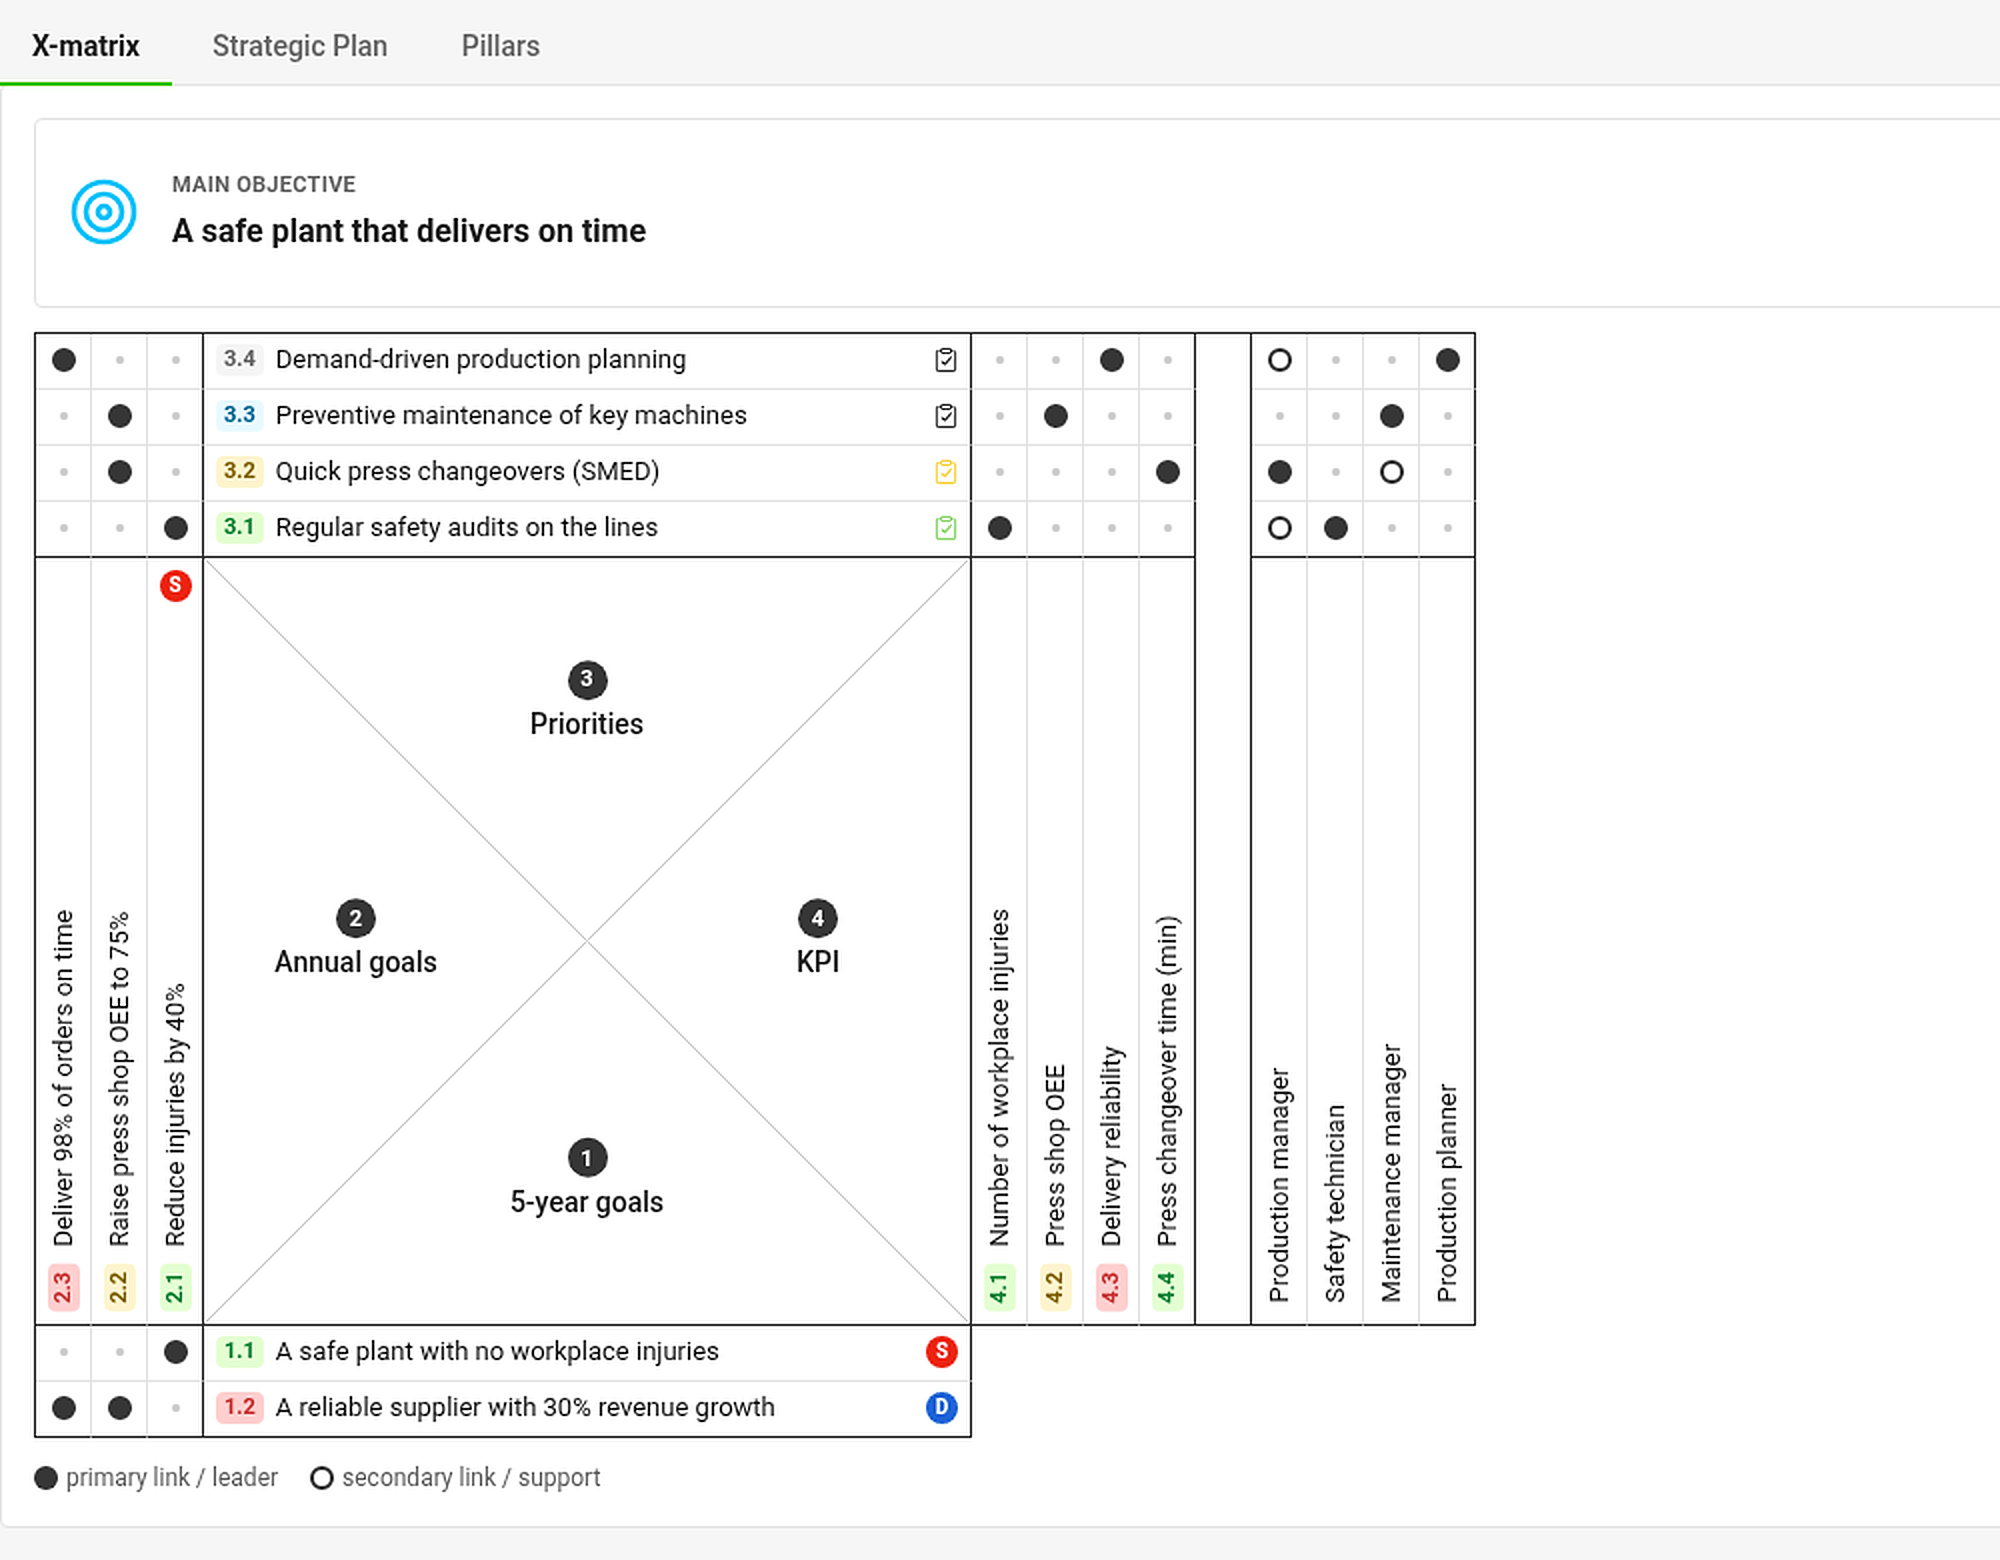
- Tabs – X-matrix, Strategic Plan and Pillars show the same plan in three different ways (see How to work with the Strategic Plan and Pillars views).
- Main objective and Plan hierarchy – the objective of the plan and the plans above and below it (see How to link X-matrices into a plan hierarchy).
- The X-matrix – the full matrix: 5-year goals at the bottom, annual goals on the left, priorities on top, KPIs (Targets to Improve) on the right and responsible people next to them. The names of the lists come from the template of the plan.
- Item codes – every item has a code made of the list number and its position, for example 2.3 is the third annual goal. The code is the same in the matrix and in every section below it.
- Dots – a filled dot is a primary link (leader), a hollow dot a secondary link (support). A small gray dot marks an empty cell that is not linked yet. The color of the code shows the status of the item.
Click an item to see what is connected
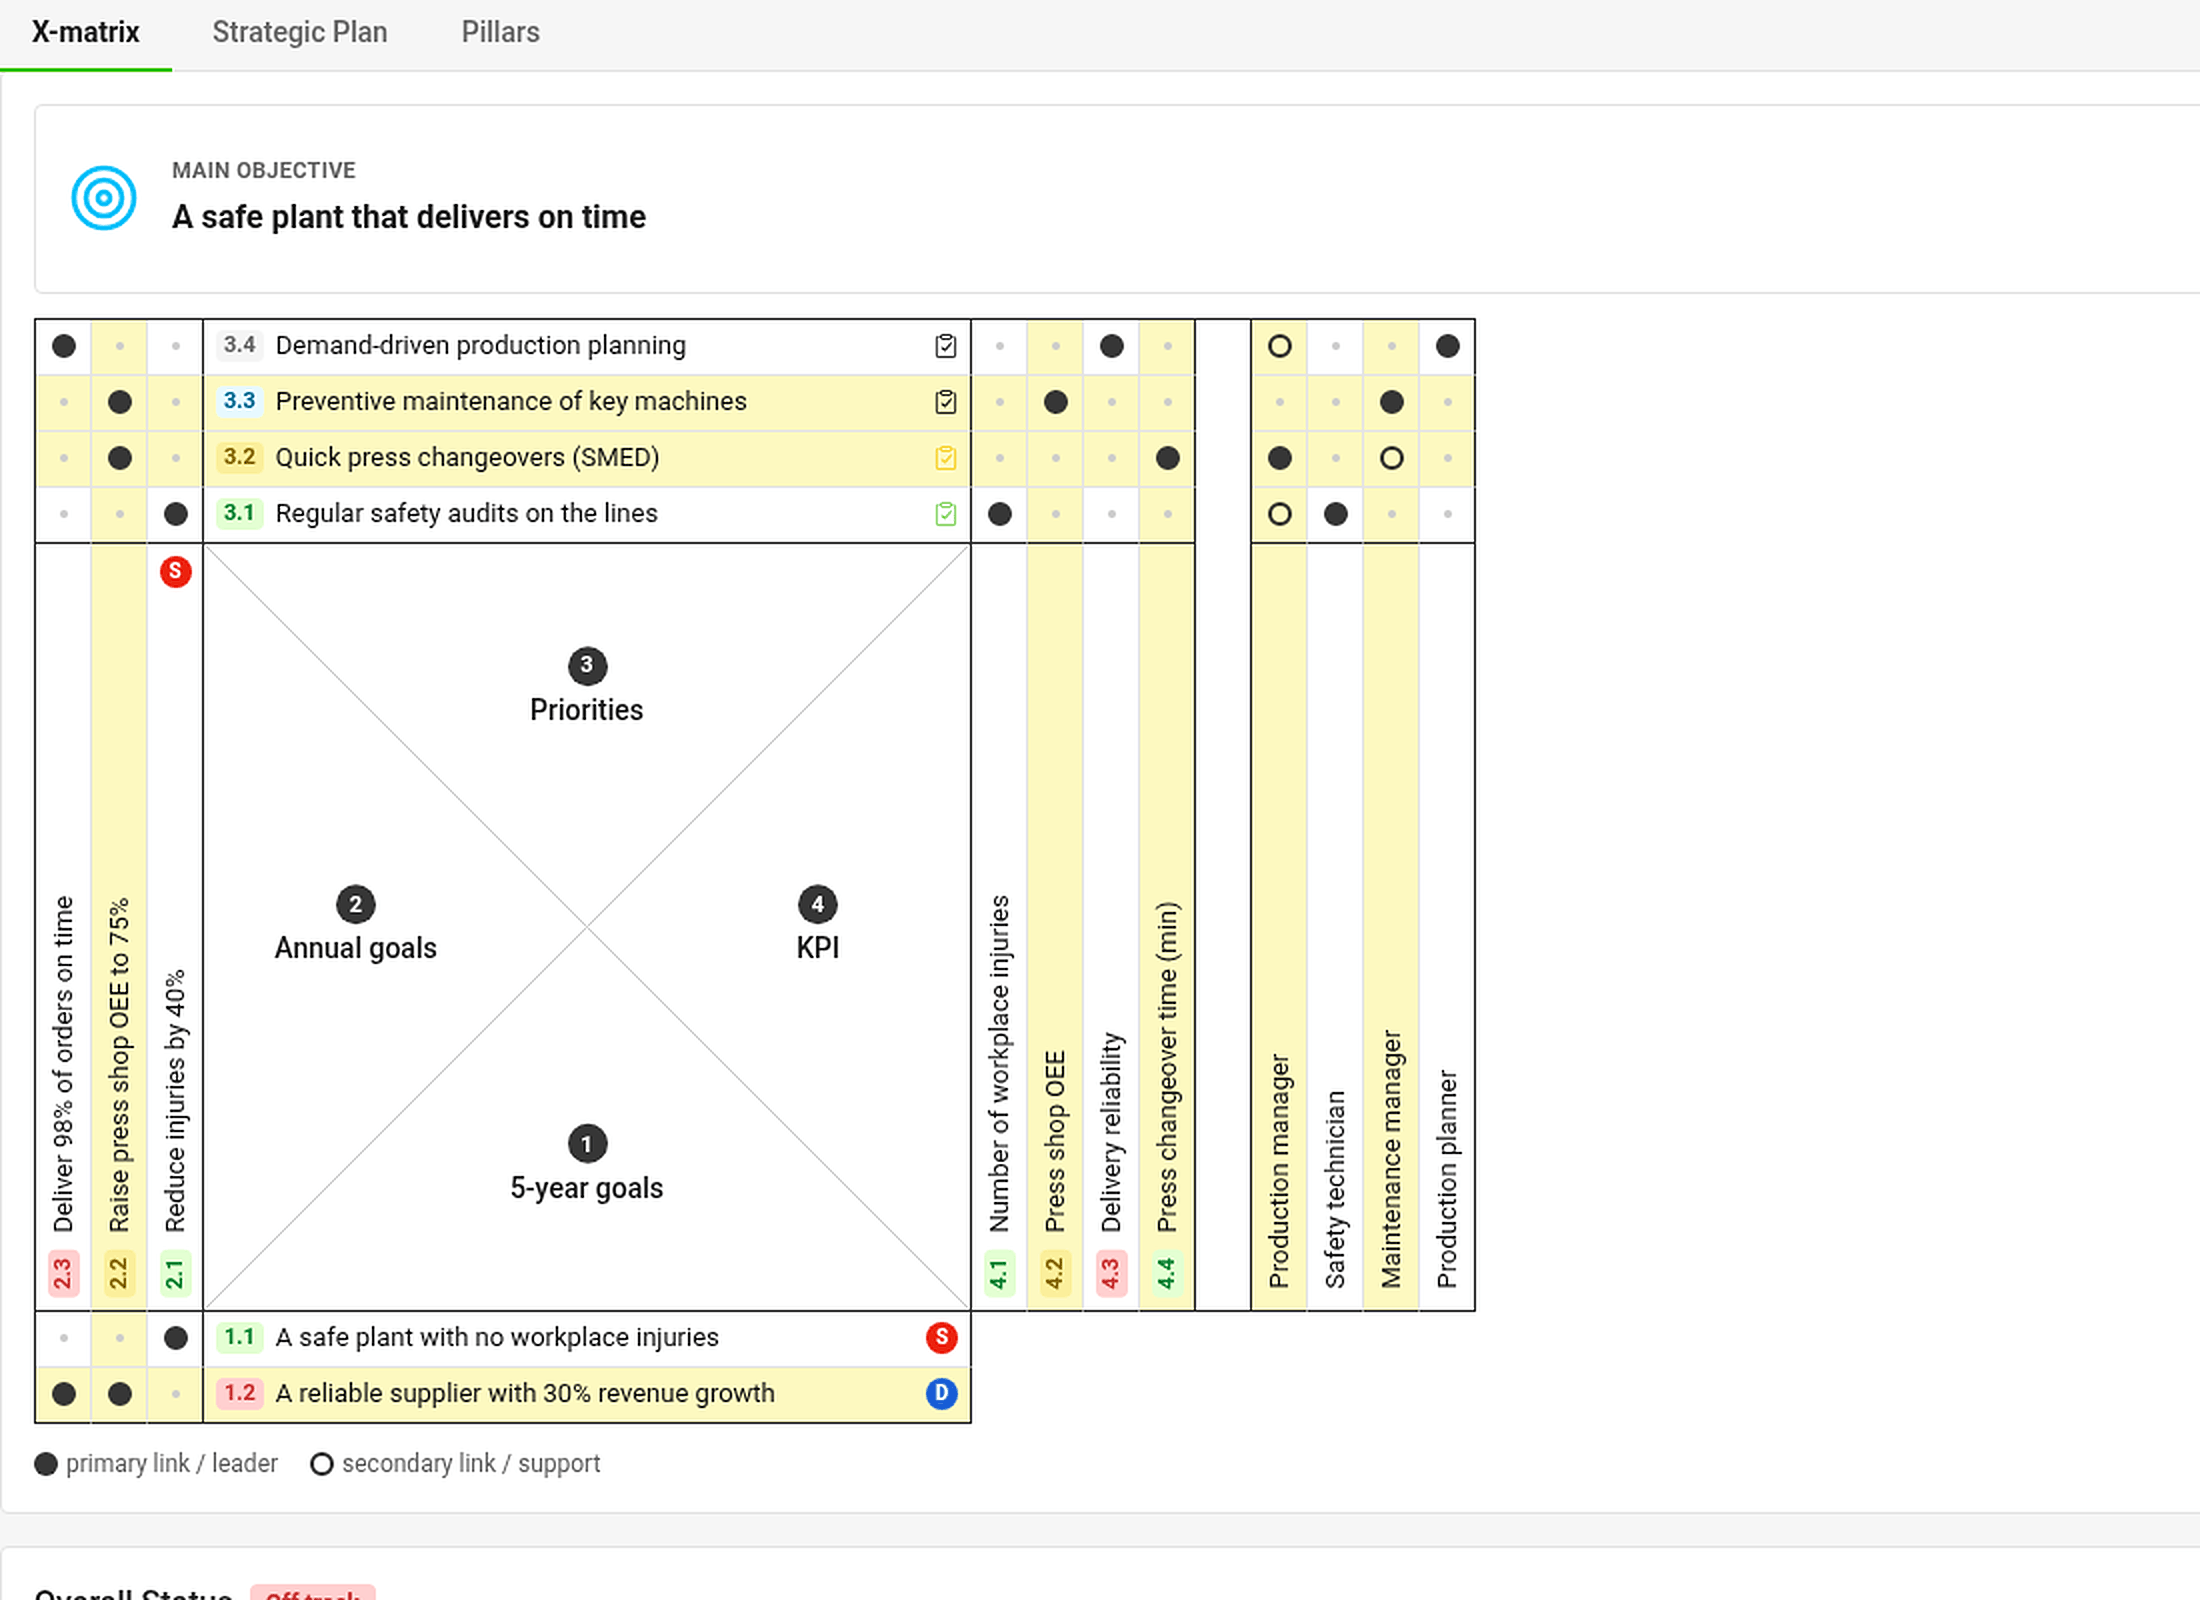
Click any label in the matrix. The item, everything above it and everything below it light up in yellow – the goals, priorities, KPIs and people that belong together. Click outside the matrix (or press Esc) to remove the highlight. The filter Show only the selected X-matrix items narrows the matrix to that chain.
Below the matrix

- Overall Status – one gauge per list of the matrix, showing how many items are on plan, and the share of the plan year that has already passed (Year elapsed). Click a gauge to jump to its section.
- Projects – every project linked to a priority, with its status, days left and percentage done (see How to link priorities to projects).
- Targets to Improve (KPIs) – a tile with a monthly chart for every KPI (see How to track KPIs).
- Responsibles – a card for every person with the codes of the priorities and KPIs they answer for.
Click any code (for example 3.2 in the Responsibles section) to jump to that item and see it briefly framed.
Who can do what
Everyone who may open the plan sees the same statuses. Buttons for editing and the settings icon appear only to people who may edit the plan. Projects, metrics and plans you are not allowed to open are shown as Hidden document or Hidden value – their status still counts, so everybody works with the same picture.
Każdy plan w module Cele strategiczne otwiera się jako dashboard przeglądu: X-Matrix i wszystko, czego potrzebujesz do przeglądu strategii (status ogólny, KPI, projekty i osoby odpowiedzialne), na jednej stronie.
Co widzisz na stronie
- Karty: X-Matrix, Plan strategiczny i Filary pokazują ten sam plan na trzy różne sposoby (zobacz Jak pracować z widokami Plan strategiczny i Filary).
- Cel główny i hierarchia planów: cel planu oraz plany nad nim i pod nim (zobacz Jak połączyć X-Matrix w hierarchię planów).
- X-Matrix: pełna matryca. Cele 5-letnie na dole, cele roczne po lewej, priorytety u góry, KPI (wartości docelowe) po prawej, a obok nich osoby odpowiedzialne. Nazwy list pochodzą z szablonu planu.
- Kody elementów: każdy element ma kod złożony z numeru listy i swojej pozycji, np. 2.3 to trzeci cel roczny. Kod jest taki sam w matrycy i we wszystkich sekcjach pod nią.
- Kropki: pełna kropka to powiązanie główne (lider), pusta kropka to powiązanie pomocnicze (wsparcie). Mała szara kropka oznacza pustą komórkę, która nie jest jeszcze powiązana. Kolor kodu pokazuje status elementu.
Kliknij element, aby zobaczyć powiązania
Kliknij dowolną etykietę w matrycy. Element oraz wszystko nad nim i pod nim podświetli się na żółto: cele, priorytety, KPI i osoby, które do siebie należą. Kliknij poza matrycą (lub naciśnij Esc), aby usunąć podświetlenie. Filtr Pokaż tylko wybrane elementy X-Matrix zawęża matrycę do tego łańcucha.
Pod matrycą
- Status ogólny: jeden wskaźnik zegarowy na każdą listę matrycy. Pokazuje, ile elementów jest zgodnych z planem, oraz jaka część roku planu już upłynęła (Upłynęło z roku). Kliknij wskaźnik, aby przejść do jego sekcji.
- Projekty: każdy projekt powiązany z priorytetem, z jego statusem, liczbą pozostałych dni i procentem wykonania (zobacz Jak powiązać priorytety z projektami).
- Wartości docelowe (KPI): kafelek z wykresem miesięcznym dla każdego KPI (zobacz Jak śledzić KPI).
- Osoby odpowiedzialne: karta dla każdej osoby z kodami priorytetów i KPI, za które odpowiada.
Kliknij dowolny kod (np. 3.2 w sekcji Osoby odpowiedzialne), aby przejść do tego elementu. Zostanie na chwilę obramowany.
Kto co może
Każdy, kto może otworzyć plan, widzi te same statusy. Przyciski edycji i ikona ustawień są widoczne tylko dla osób, które mogą edytować plan. Projekty, wskaźniki i plany, których nie możesz otworzyć, są oznaczone jako Ukryty dokument lub Ukryta wartość. Ich status nadal się liczy, więc wszyscy pracują na tym samym obrazie sytuacji.
Potrzebujesz dalszej pomocy?
Napisz do nas. W dni robocze zwykle odpowiadamy w ciągu godziny.