So funktioniert das Review-Dashboard im Modul Strategische Ziele
Maschinelle Übersetzung aus dem Englischen. Englisches Original wird angezeigt.
Every Strategy Deployment plan opens as a review dashboard: the X-matrix and everything you need for a strategy review – overall status, KPIs, projects and responsible people – on one page.
What you see on the page
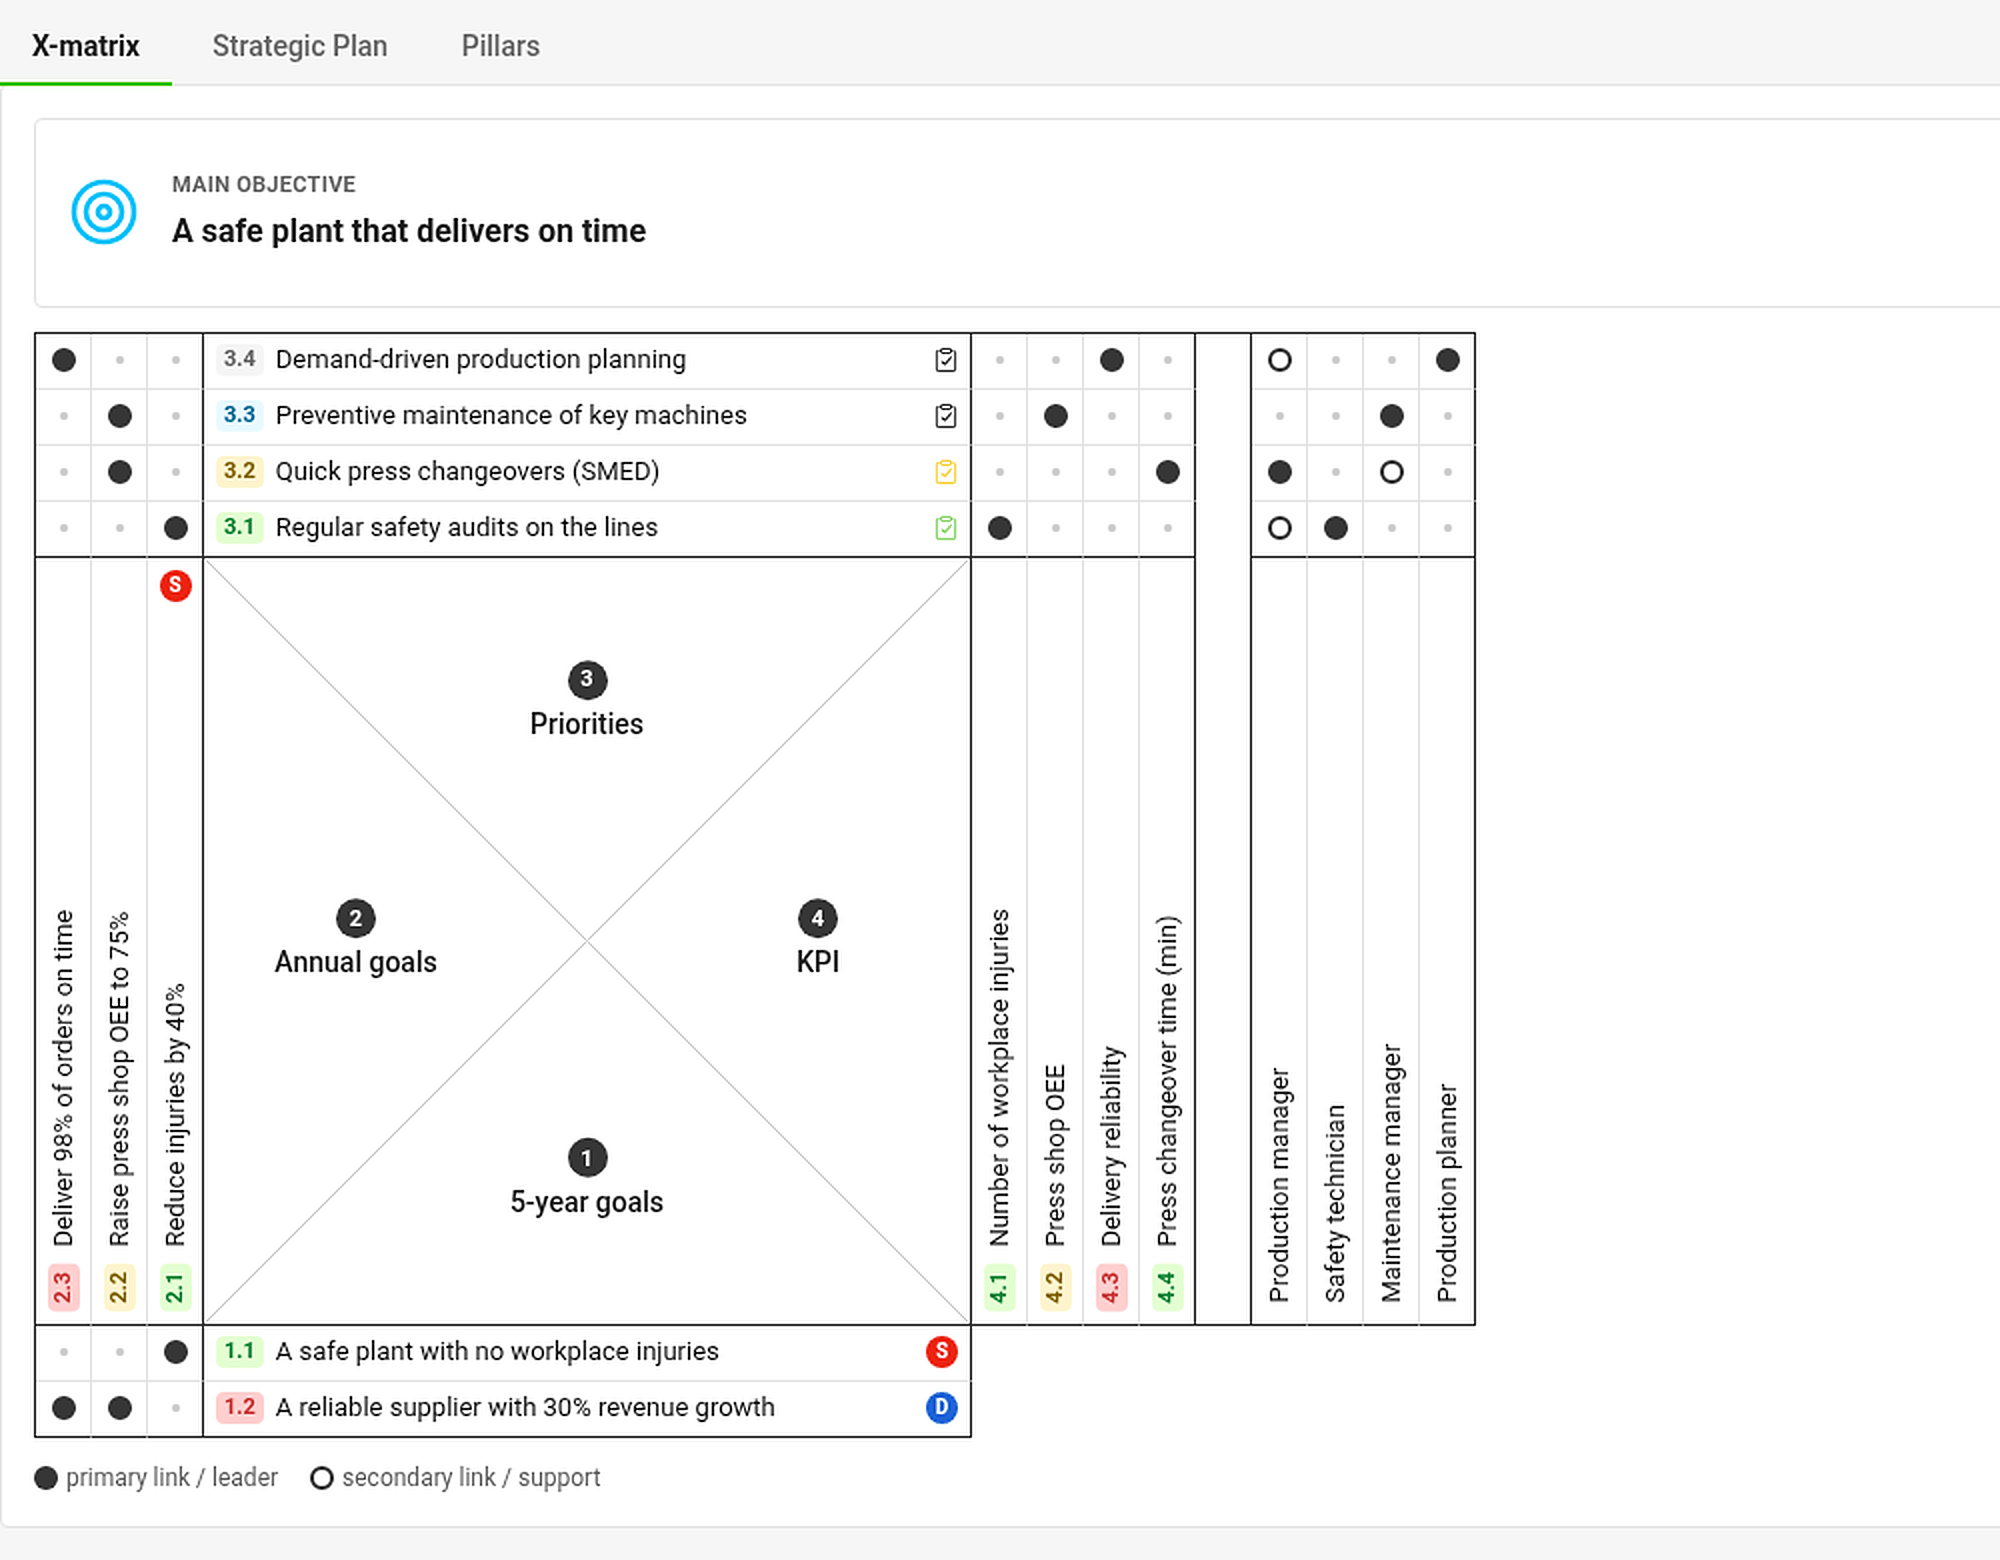
- Tabs – X-matrix, Strategic Plan and Pillars show the same plan in three different ways (see How to work with the Strategic Plan and Pillars views).
- Main objective and Plan hierarchy – the objective of the plan and the plans above and below it (see How to link X-matrices into a plan hierarchy).
- The X-matrix – the full matrix: 5-year goals at the bottom, annual goals on the left, priorities on top, KPIs (Targets to Improve) on the right and responsible people next to them. The names of the lists come from the template of the plan.
- Item codes – every item has a code made of the list number and its position, for example 2.3 is the third annual goal. The code is the same in the matrix and in every section below it.
- Dots – a filled dot is a primary link (leader), a hollow dot a secondary link (support). A small gray dot marks an empty cell that is not linked yet. The color of the code shows the status of the item.
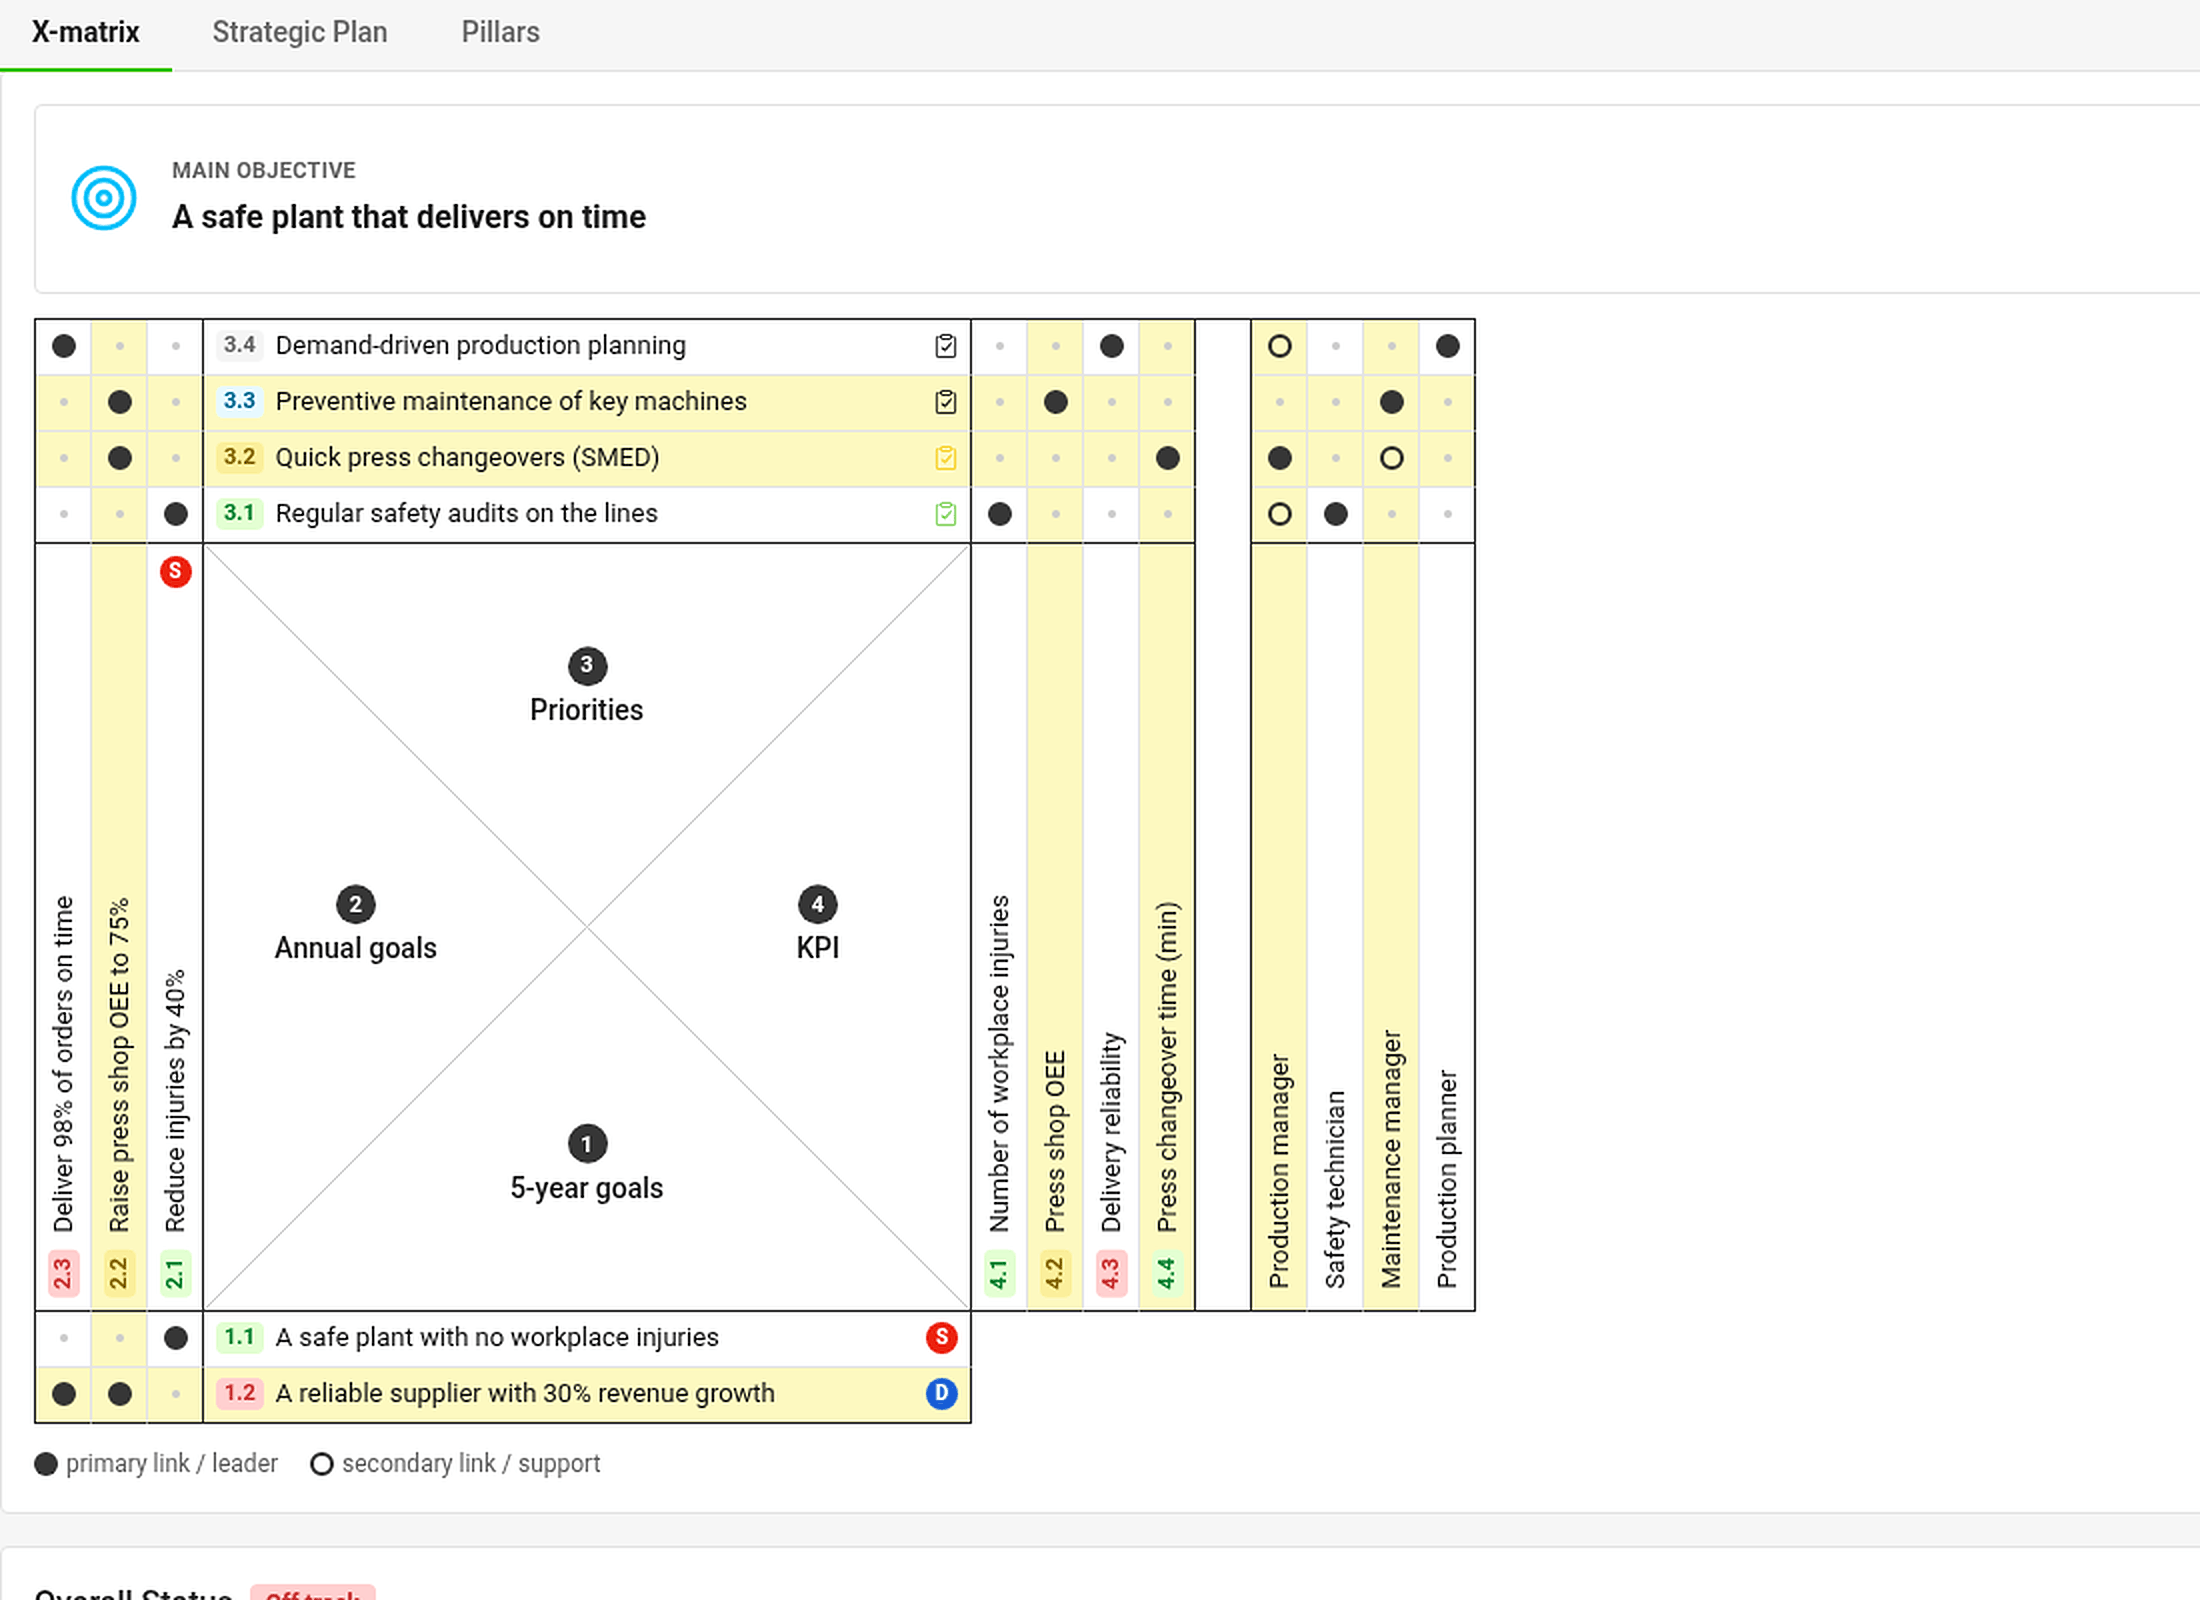
Click an item to see what is connected
Click any label in the matrix. The item, everything above it and everything below it light up in yellow – the goals, priorities, KPIs and people that belong together. Click outside the matrix (or press Esc) to remove the highlight. The filter Show only the selected X-matrix items narrows the matrix to that chain.
Below the matrix

- Overall Status – one gauge per list of the matrix, showing how many items are on plan, and the share of the plan year that has already passed (Year elapsed). Click a gauge to jump to its section.
- Projects – every project linked to a priority, with its status, days left and percentage done (see How to link priorities to projects).
- Targets to Improve (KPIs) – a tile with a monthly chart for every KPI (see How to track KPIs).
- Responsibles – a card for every person with the codes of the priorities and KPIs they answer for.
Click any code (for example 3.2 in the Responsibles section) to jump to that item and see it briefly framed.
Who can do what
Everyone who may open the plan sees the same statuses. Buttons for editing and the settings icon appear only to people who may edit the plan. Projects, metrics and plans you are not allowed to open are shown as Hidden document or Hidden value – their status still counts, so everybody works with the same picture.
Jeder Plan im Modul Strategische Ziele öffnet sich als Review-Dashboard: die X-Matrix und alles, was Sie für ein Strategie-Review brauchen – Gesamtstatus, KPIs, Projekte und Verantwortliche – auf einer Seite.
Was Sie auf der Seite sehen
- Registerkarten – X-Matrix, Strategieplan und Säulen zeigen denselben Plan auf drei verschiedene Arten (siehe So arbeiten Sie mit den Ansichten Strategieplan und Säulen).
- Hauptziel und Planhierarchie – das Ziel des Plans und die Pläne über und unter ihm (siehe So verknüpfen Sie X-Matrizen zu einer Planhierarchie).
- Die X-Matrix – die vollständige Matrix: 5-Jahres-Ziele unten, Jahresziele links, Prioritäten oben, KPIs (Zielwerte) rechts und daneben die Verantwortlichen. Die Namen der Listen stammen aus der Vorlage des Plans.
- Elementcodes – jedes Element hat einen Code aus der Listennummer und seiner Position, zum Beispiel ist 2.3 das dritte Jahresziel. Der Code ist in der Matrix und in allen Abschnitten darunter derselbe.
- Punkte – ein gefüllter Punkt ist eine primäre Verknüpfung (führend), ein leerer Punkt eine sekundäre Verknüpfung (unterstützend). Ein kleiner grauer Punkt markiert eine leere Zelle, die noch nicht verknüpft ist. Die Farbe des Codes zeigt den Status des Elements.
Klicken Sie auf ein Element, um seine Verknüpfungen zu sehen
Klicken Sie auf eine beliebige Beschriftung in der Matrix. Das Element und alles darüber und darunter wird gelb hervorgehoben – die Ziele, Prioritäten, KPIs und Personen, die zusammengehören. Ein Klick außerhalb der Matrix (oder Esc) hebt die Hervorhebung auf. Der Filter Nur ausgewählte X-Matrix-Elemente anzeigen beschränkt die Matrix auf diese Kette.
Unter der Matrix
- Gesamtstatus – eine Anzeige je Liste der Matrix, die zeigt, wie viele Elemente im Plan sind, und welcher Anteil des Planjahres schon vergangen ist (Jahresfortschritt). Ein Klick auf eine Anzeige springt zum zugehörigen Abschnitt.
- Projekte – alle mit einer Priorität verknüpften Projekte mit Status, verbleibenden Tagen und Fertigstellungsgrad in Prozent (siehe So verknüpfen Sie Prioritäten mit Projekten).
- Zielwerte (KPIs) – eine Kachel mit Monatsdiagramm für jeden KPI (siehe So verfolgen Sie KPIs).
- Verantwortliche – eine Karte je Person mit den Codes der Prioritäten und KPIs, für die sie verantwortlich ist.
Klicken Sie auf einen Code (zum Beispiel 3.2 im Abschnitt Verantwortliche), um zu diesem Element zu springen; es wird kurz umrahmt.
Wer was darf
Alle, die den Plan öffnen dürfen, sehen dieselben Status. Bearbeitungsschaltflächen und das Einstellungssymbol sehen nur Personen, die den Plan bearbeiten dürfen. Projekte, Kennzahlen und Pläne, die Sie nicht öffnen dürfen, erscheinen als Verborgenes Dokument oder Verborgener Wert – ihr Status zählt trotzdem, damit alle mit demselben Bild arbeiten.
Brauchen Sie weitere Hilfe?
Schreiben Sie uns. An Werktagen antworten wir meist innerhalb einer Stunde.