Ako zadávať údaje do KPI dashboardu
Strojový preklad z angličtiny. Zobrazený je anglický originál.
Learn how to enter data into a metric dashboard, either in the Data view or in the Spreadsheet view.
Video guide
The text instructions follow below the video.
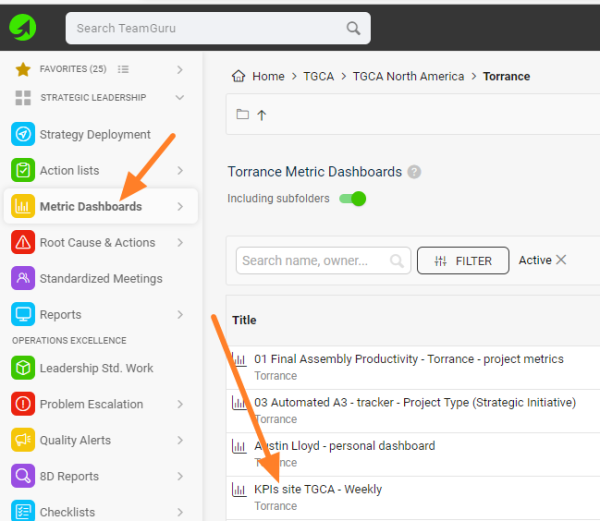
Open your metric dashboard
In the Metric Dashboards module, click the dashboard’s title.
Option 1: Data view
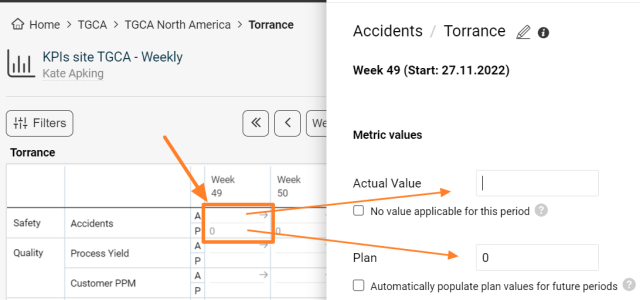
Enter values in a cell
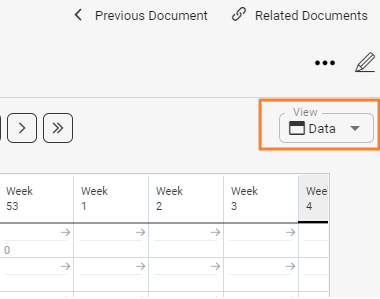
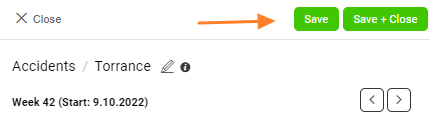
In the Data view, click into your org. unit/metric cell, enter the Actual and/or Plan values, and click the Save & Close button.
Option 2: Spreadsheet view
-
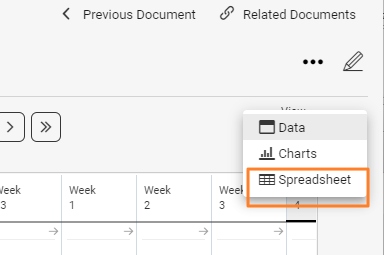
Switch to the spreadsheet. Select the Spreadsheet view.
-
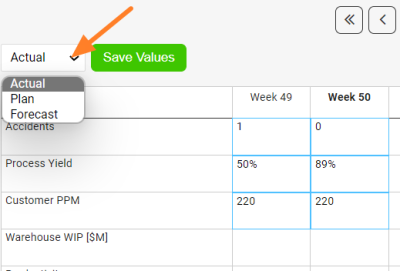
Choose the type of values. Choose whether you want to enter Actual, Planned or Forecasted data. This is very important, so that you don’t overwrite values that are already entered.
-
Enter the values. You can use the standard copy and paste function.
-
Save the values. Save the entered values.
-
Review the data. Change the view back to the Data view to review the entered data.
Related articles: How to display forecast values in a dashboard, Data Entry and View Restrictions
Pozrite si, ako zadávať údaje do KPI dashboardu v zobrazení Údaje alebo v zobrazení Tabuľka.
Video návod
Textový postup nájdete pod videom.
Otvorte KPI dashboard
V module KPI dashboardy kliknite na názov dashboardu.
Možnosť 1: zobrazenie Údaje
Zadajte hodnoty do bunky
V zobrazení Údaje kliknite do bunky org. jednotky/metriky, zadajte skutočnú a/alebo plánovanú hodnotu a kliknite na tlačidlo Uložiť a zavrieť.
Možnosť 2: zobrazenie Tabuľka
-
Prepnite na tabuľku. Zvoľte zobrazenie Tabuľka.
-
Zvoľte typ hodnôt. Vyberte, či chcete zadávať skutočné, plánované alebo prognózované údaje. Je to veľmi dôležité, aby ste neprepísali už zadané hodnoty.
-
Zadajte hodnoty. Môžete použiť bežné kopírovanie a vkladanie.
-
Uložte hodnoty. Zadané hodnoty uložte.
-
Skontrolujte údaje. Prepnite späť na zobrazenie Údaje a skontrolujte zadané údaje.
Potrebujete ďalšiu pomoc?
Napíšte nám. V pracovné dni zvyčajne odpovedáme do hodiny.