Cómo ingresar datos en un dashboard de KPI
Traducción automática del inglés. Se muestra el original en inglés.
Learn how to enter data into a metric dashboard, either in the Data view or in the Spreadsheet view.
Video guide
The text instructions follow below the video.
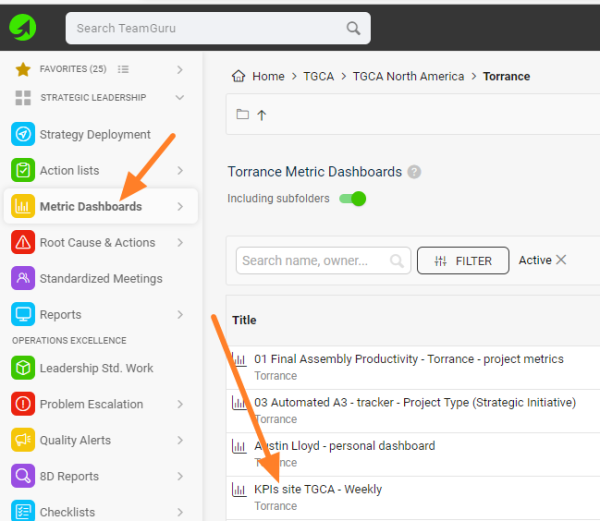
Open your metric dashboard
In the Metric Dashboards module, click the dashboard’s title.
Option 1: Data view
Enter values in a cell
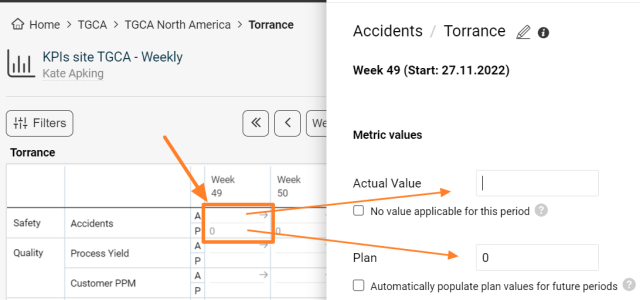
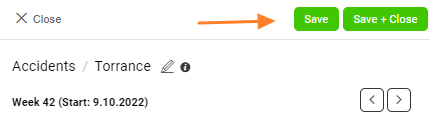
In the Data view, click into your org. unit/metric cell, enter the Actual and/or Plan values, and click the Save & Close button.
Option 2: Spreadsheet view
-
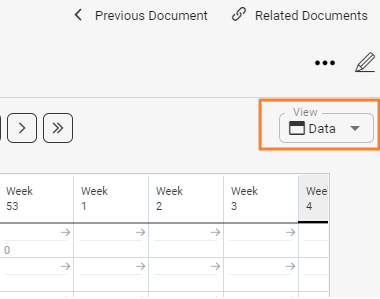
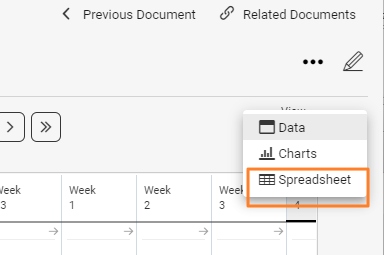
Switch to the spreadsheet. Select the Spreadsheet view.
-
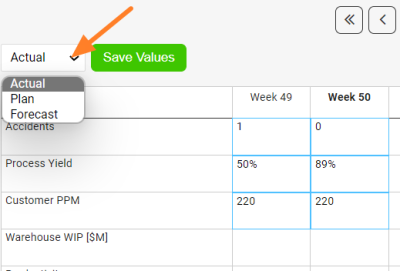
Choose the type of values. Choose whether you want to enter Actual, Planned or Forecasted data. This is very important, so that you don’t overwrite values that are already entered.
-
Enter the values. You can use the standard copy and paste function.
-
Save the values. Save the entered values.
-
Review the data. Change the view back to the Data view to review the entered data.
Related articles: How to display forecast values in a dashboard, Data Entry and View Restrictions
Aprenda a ingresar datos en un dashboard de KPI, ya sea en la vista Datos o en la vista Hoja de cálculo.
Video
Las instrucciones escritas están debajo del video.
Abra su dashboard de KPI
En el módulo Dashboards de KPI, haga clic en el título del dashboard.
Opción 1: vista Datos
Ingrese los valores en una celda
En la vista Datos, haga clic en la celda de su unidad organizativa y métrica, ingrese los valores Real y/o Plan, y haga clic en el botón Guardar y cerrar.
Opción 2: vista Hoja de cálculo
-
Cambie a la hoja de cálculo. Seleccione la vista Hoja de cálculo.
-
Elija el tipo de valores. Elija si quiere ingresar datos reales, planificados o de pronóstico. Esto es muy importante para no sobrescribir valores ya ingresados.
-
Ingrese los valores. Puede usar las funciones habituales de copiar y pegar.
-
Guarde los valores. Guarde los valores ingresados.
-
Revise los datos. Vuelva a la vista Datos para revisar los datos ingresados.
Artículos relacionados: Cómo mostrar valores de pronóstico en un dashboard, Restricciones de ingreso y visualización de datos
¿Necesita más ayuda?
Escríbanos. En días laborables solemos responder en menos de una hora.