如何向指标仪表板录入数据
本文由英文机器翻译。 当前显示英文原文。
Learn how to enter data into a metric dashboard, either in the Data view or in the Spreadsheet view.
Video guide
The text instructions follow below the video.
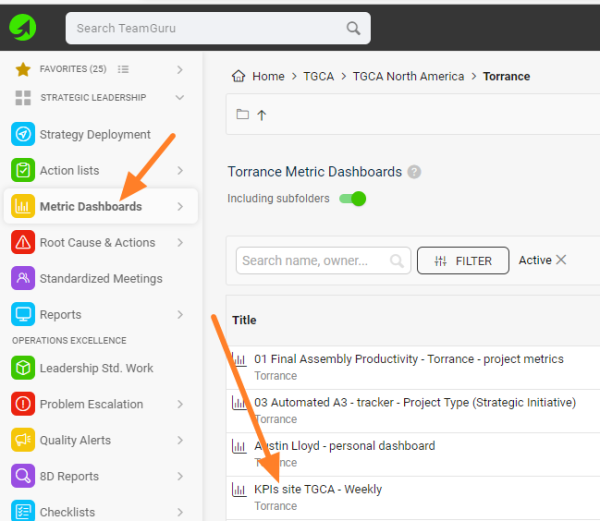
Open your metric dashboard
In the Metric Dashboards module, click the dashboard’s title.
Option 1: Data view
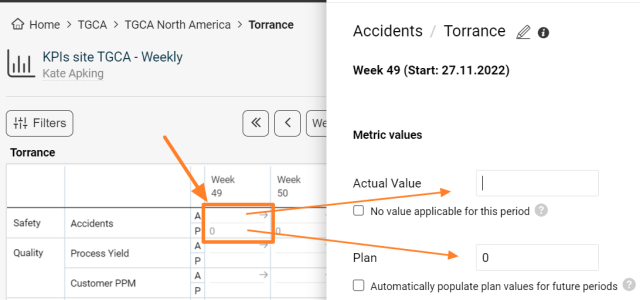
Enter values in a cell
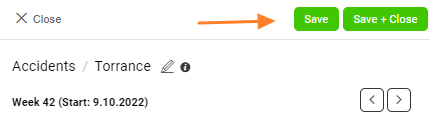
In the Data view, click into your org. unit/metric cell, enter the Actual and/or Plan values, and click the Save & Close button.
Option 2: Spreadsheet view
-
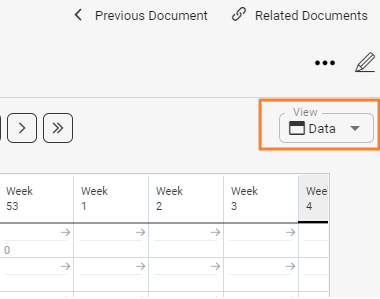
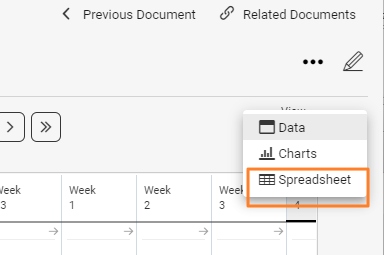
Switch to the spreadsheet. Select the Spreadsheet view.
-
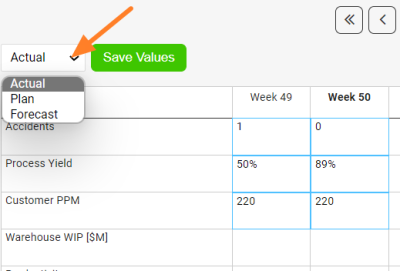
Choose the type of values. Choose whether you want to enter Actual, Planned or Forecasted data. This is very important, so that you don’t overwrite values that are already entered.
-
Enter the values. You can use the standard copy and paste function.
-
Save the values. Save the entered values.
-
Review the data. Change the view back to the Data view to review the entered data.
Related articles: How to display forecast values in a dashboard, Data Entry and View Restrictions
了解如何在数据视图或电子表格视图中向指标仪表板录入数据。
视频指南
文字说明见视频下方。
打开指标仪表板
在 指标仪表板 模块中,点击仪表板标题。
方式一:数据视图
在单元格中输入数值
在 数据 视图中,点击组织单元/指标对应的单元格,输入实际值和/或计划值,然后点击 保存并关闭 按钮。
方式二:电子表格视图
-
切换到电子表格。 选择 电子表格 视图。
-
选择数值类型。 选择要录入实际值、计划值还是预测值。这一点非常重要,可避免覆盖已录入的数值。
-
输入数值。 可以使用常规的复制粘贴功能。
-
保存数值。 保存已输入的数值。
-
检查数据。 切换回 数据 视图,检查已录入的数据。
相关文章:如何在仪表板中显示预测值、数据录入和查看限制
还需要帮助吗?
请给我们留言。工作日我们通常会在一小时内回复。