Jak utworzyć nowy dashboard
Tłumaczenie maszynowe z angielskiego. Wyświetlany jest oryginał po angielsku.
Use metric dashboards to track your metrics (KPIs) for different parts of your organization (e.g. sites), for partners (suppliers or customers) or for projects.
Create the dashboard
-
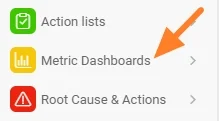
Open the module. Click the Metric Dashboards module.
-
Create a new dashboard. Click the Create New icon.
-
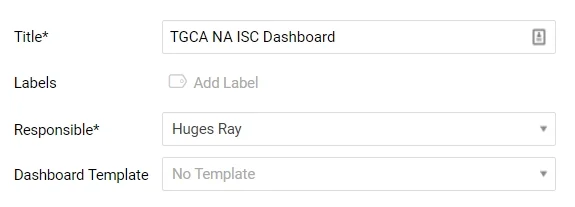
Fill in the main information. Complete the main information, such as Title, Responsible, etc.
-
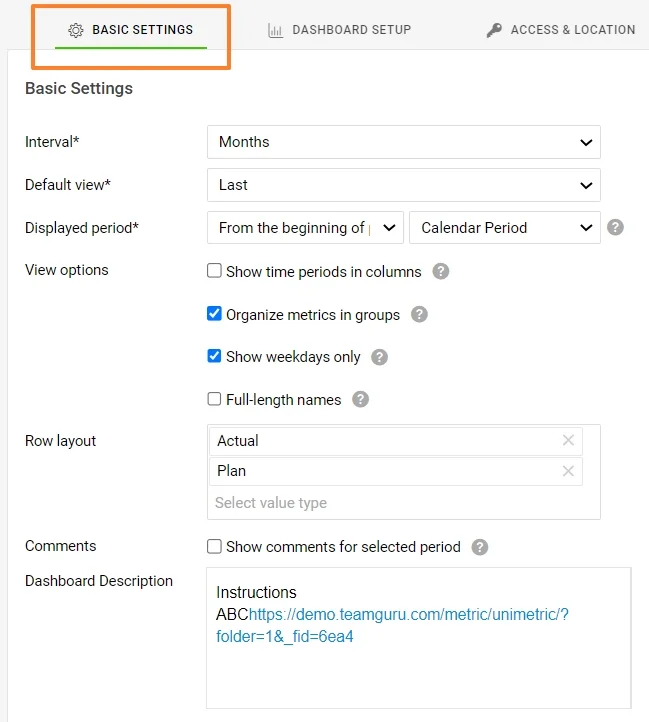
Define the basic settings. Define the default information on the Basic Settings tab, such as the interval, the default view, etc.
-
Save the basic data. When the basic data is filled in, click the Save button.
Add org. units, metrics and responsible people
-
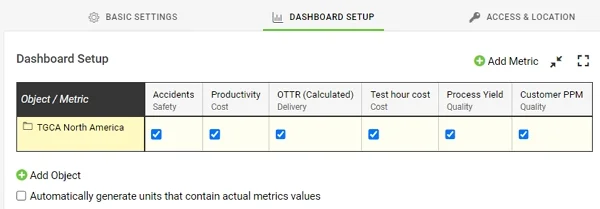
Add org. units and metrics. On the Dashboard Setup tab, choose your organization units and metrics by clicking the Add icons.
-
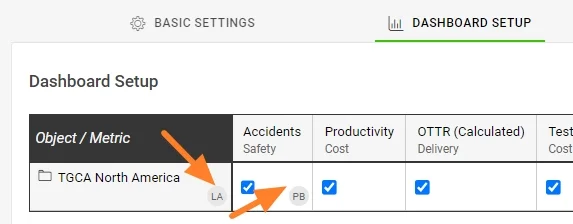
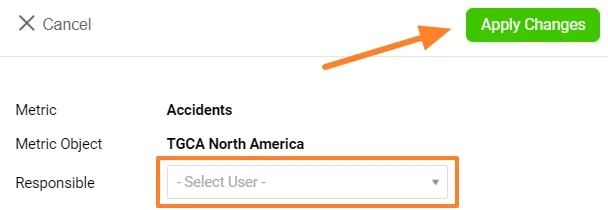
Add the responsible people. To add a Responsible person, click your org. unit (if they are responsible for the whole site), or click into the org. unit/metric cell (if they are responsible for a specific metric only). The responsible person’s initials are displayed next to it.
If the organization units are not set up in your TeamGuru yet, see How I manage the organization structure. If the metric you want to track is not defined in the system yet, see How to create a new metric. You need a sufficient role for this.
Set access and location
-
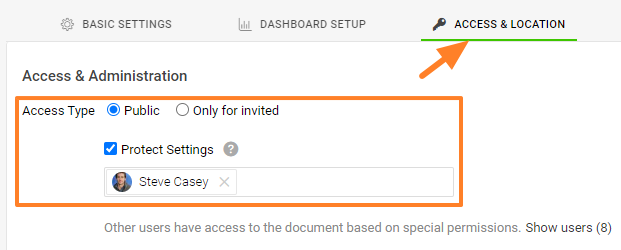
Choose the access type. Go to the Access & Location tab and select the Access Type: share your dashboard with everyone who has sufficient access, or only with invited people. If you choose Only for invited, select the invitees from the menu (they must be set up as active or passive users in the system). Passive users can only receive notifications, if any are set up.
Protect Settings: if you tick this box, only the responsible person and the selected document administrators can change the settings of this dashboard.
-
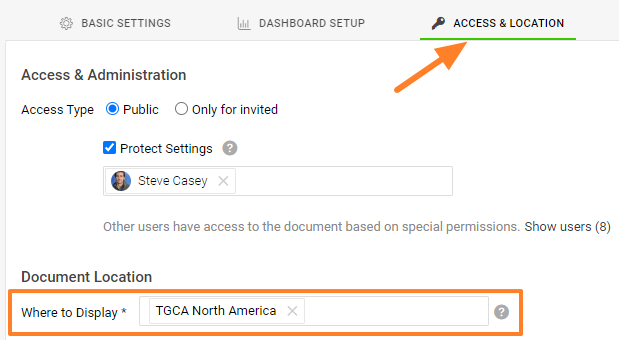
Set the document location. In Document Location, select where the new dashboard should be saved and displayed.
-
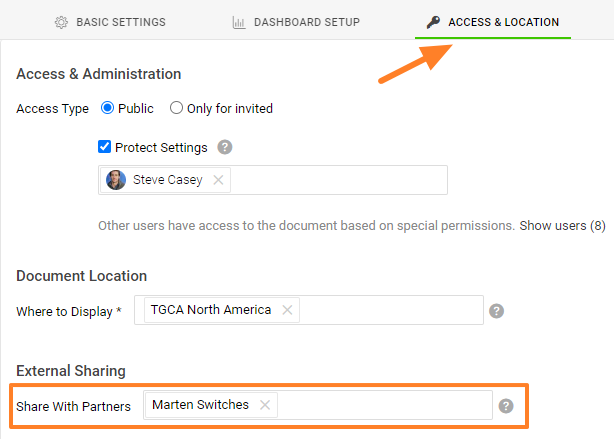
Share with external partners. You can share your document with External Partners: select the existing partners from the menu. If you need to create a new partner in the system, follow this link.
Connect documents and set up notifications
-
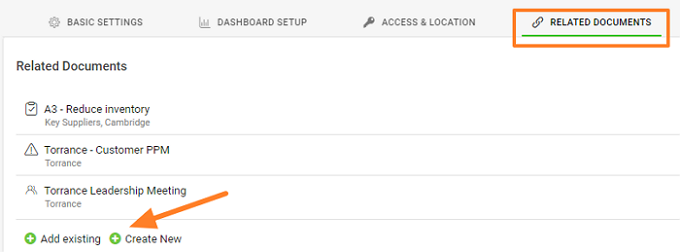
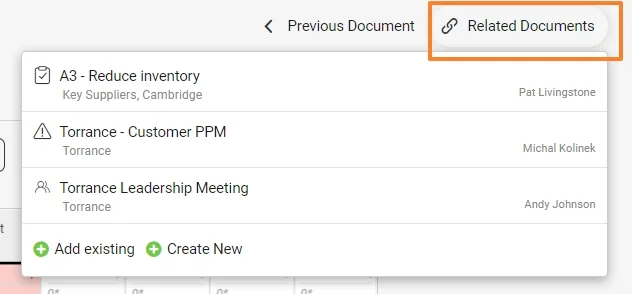
Set up related documents. Set up Related Documents on their tab. You then find these documents and their live links under the Related Documents button in the upper right corner above your document. You can also set up related documents directly from there.
-
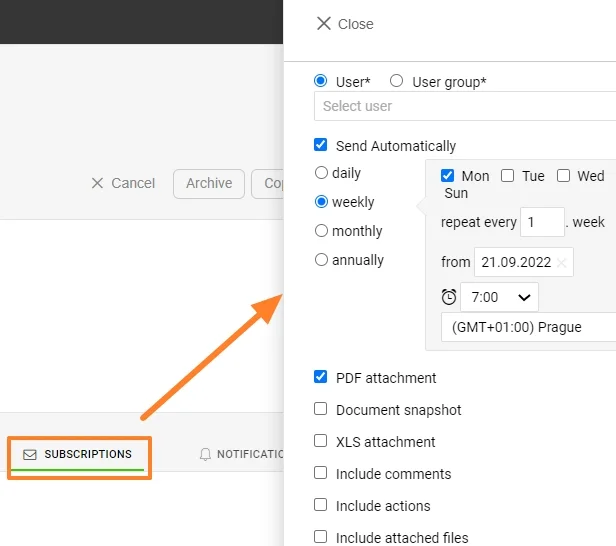
Set up subscriptions. Set up Subscriptions to receive notification emails.
-
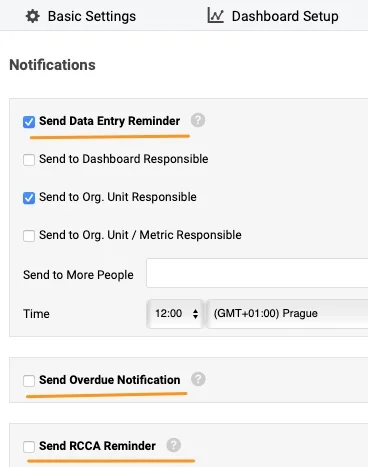
Set up notifications. Set up email Notifications to receive reminders.
Review and use the dashboard
-
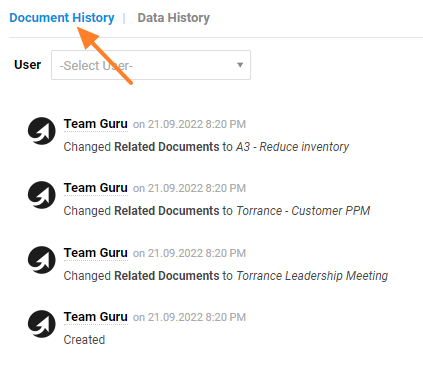
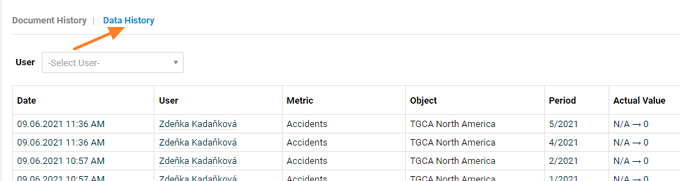
Check the history. Check the History log, where you can see the document history or the data history.

-
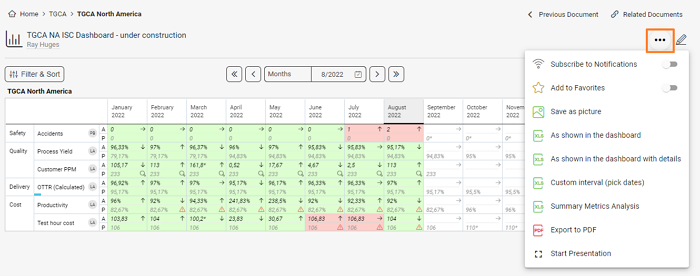
Use the additional features. View your dashboard and use the additional features: subscribe to your document or add it to Favorites, Save as picture, or export your dashboard to XLS or PDF in different ways. You can also start a presentation of your dashboard.
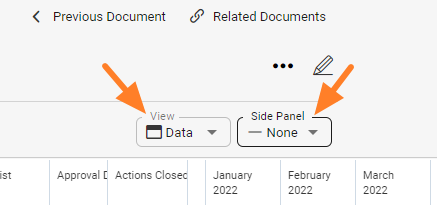
The view options let you see the dashboard as Data, Spreadsheet or Charts, and the Side Panel shows the Attachments, Actions and Comments used in the dashboard.
Video guide: Metric dashboards
Dashboardy KPI służą do śledzenia wskaźników (KPI) w różnych częściach organizacji (np. w zakładach), u partnerów (dostawców lub klientów) albo w projektach.
Utwórz dashboard
-
Otwórz moduł. Kliknij moduł Dashboardy KPI.
-
Utwórz nowy dashboard. Kliknij ikonę Utwórz nowy.
-
Wpisz główne informacje. Uzupełnij główne informacje, takie jak Tytuł, Odpowiedzialny itd.
-
Ustaw ustawienia podstawowe. Na karcie Ustawienia podstawowe określ wartości domyślne, np. interwał czy widok domyślny.
-
Zapisz podstawowe dane. Po uzupełnieniu podstawowych danych kliknij przycisk Zapisz.
Dodaj jednostki organizacyjne, wskaźniki i osoby odpowiedzialne
-
Dodaj jednostki i wskaźniki. Na karcie Konfiguracja dashboardu wybierz jednostki organizacyjne i wskaźniki, klikając ikony Dodaj.
-
Dodaj osoby odpowiedzialne. Aby dodać osobę Odpowiedzialną, kliknij jednostkę organizacyjną (jeśli odpowiada za cały zakład) lub komórkę jednostka/wskaźnik (jeśli odpowiada tylko za konkretny wskaźnik). Obok pojawią się inicjały osoby odpowiedzialnej.
Jeśli jednostki organizacyjne nie są jeszcze skonfigurowane w TeamGuru, zobacz Jak zarządzać strukturą organizacyjną. Jeśli wskaźnik, który chcesz śledzić, nie jest jeszcze zdefiniowany w systemie, zobacz Jak utworzyć nowy wskaźnik. Potrzebujesz do tego odpowiedniej roli.
Ustaw dostęp i lokalizację
-
Wybierz typ dostępu. Otwórz kartę Dostęp i lokalizacja i wybierz Typ dostępu: udostępnij dashboard wszystkim z odpowiednimi uprawnieniami albo tylko zaproszonym osobom. Jeśli wybierzesz Tylko dla zaproszonych, wybierz zaproszone osoby z menu (muszą być w systemie aktywnymi lub pasywnymi użytkownikami). Użytkownicy pasywni mogą tylko otrzymywać powiadomienia, jeśli zostały ustawione.
Chroń ustawienia: gdy zaznaczysz to pole, ustawienia dashboardu będą mogli zmieniać tylko osoba odpowiedzialna i wybrani administratorzy dokumentu.
-
Ustaw lokalizację dokumentu. W polu Lokalizacja dokumentu wybierz, gdzie nowy dashboard ma być zapisany i wyświetlany.
-
Udostępnij partnerom zewnętrznym. Dokument możesz udostępnić Partnerom zewnętrznym: wybierz istniejących partnerów z menu. Jeśli musisz utworzyć w systemie nowego partnera, skorzystaj z tego linku.
Powiąż dokumenty i ustaw powiadomienia
-
Ustaw powiązane dokumenty. Dodaj Powiązane dokumenty na ich karcie. Znajdziesz je potem wraz z aktywnymi linkami pod przyciskiem Powiązane dokumenty w prawym górnym rogu nad dokumentem. Powiązane dokumenty możesz też dodawać bezpośrednio tam.
-
Ustaw subskrypcje. Ustaw Subskrypcje, aby dostawać powiadomienia e-mail.
-
Ustaw powiadomienia. Ustaw Powiadomienia e-mail, aby dostawać przypomnienia.
Przeglądaj dashboard i korzystaj z niego
-
Sprawdź historię. Zajrzyj do Historii, gdzie zobaczysz historię dokumentu lub historię danych.
-
Korzystaj z dodatkowych funkcji. Otwórz dashboard i skorzystaj z dodatkowych funkcji: zasubskrybuj dokument lub dodaj go do Ulubionych, użyj Zapisz jako obraz albo wyeksportuj dashboard na kilka sposobów do XLS lub PDF. Możesz też uruchomić prezentację dashboardu.
Opcje widoku pozwalają oglądać dashboard jako Dane, Arkusz lub Wykresy, a Panel boczny pokazuje Załączniki, Działania i Komentarze użyte w dashboardzie.
Wideo: Dashboardy KPI
Potrzebujesz dalszej pomocy?
Napisz do nas. W dni robocze zwykle odpowiadamy w ciągu godziny.