指标的高级设置
本文由英文机器翻译。 当前显示英文原文。
First see the basic metric settings, then follow these instructions to complete the Optional: Advanced Settings of your metric.
Describe the metric
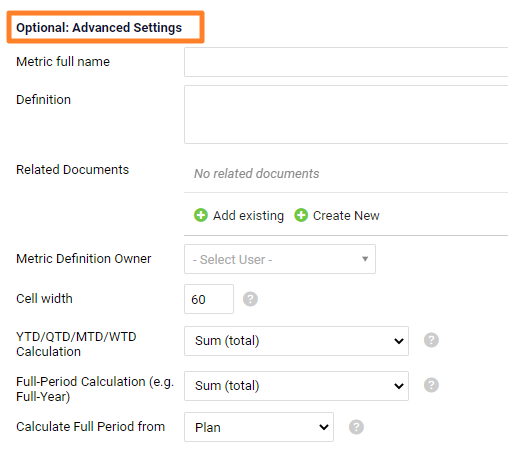
- Metric’s full name explains an abbreviation used in the title of the metric (e.g. OTTR – On-Time to Request).
- The metric’s Definition helps the team understand how to measure and report data correctly.
- Related Documents link your metric to other documents that provide more details.
- Metric Definition Owner is an internal system user whom you can contact about the metric’s definition or other reporting details.
Set the cell width and to-date calculations
- Cell width in the metric dashboard.
- The To-Date (YTD, QTD, MTD, WTD) and Full Year Calculation formula fields can be set up as SUM, AVE, last value entered, or calculation according to a formula. You can define plan or forecast in Calculate Full Period from.
Set the chart axis and decimal places
- Chart axis minimum / maximum defines the values displayed on the chart’s Y-axis. Values below the minimum and above the maximum are hidden.
- Default no. of decimal places is the number of decimal places shown in a metric dashboard that uses this metric.
- How to assign weeks to months: select your preference.
Set up the roll-up
Set up the Roll-up function to see your daily or weekly values automatically rolled up into the monthly values. Choose the calculation from the submenu (Sum, Average etc.) and select the Calendar type.
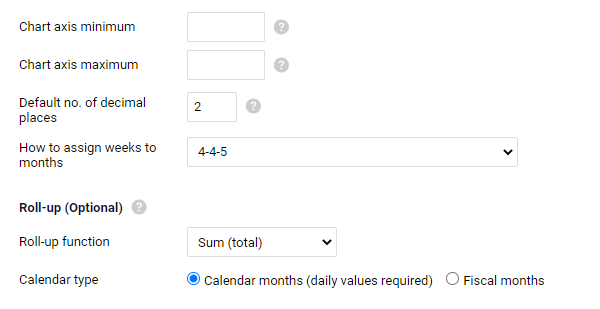
The Calendar month roll-up can be used for daily or monthly data only. If you collect data weekly, you have to roll up your monthly values according to the Fiscal Calendar (4-4-5 or 5-4-4).
If your company does not use a fiscal calendar, choose the Calendar months option and enter both the weekly and the monthly data manually, without system calculation. Quarterly and yearly numbers are calculated automatically. The system cannot calculate a calendar month value from weekly numbers, because one week can be split between two months.
Make it a calculated metric
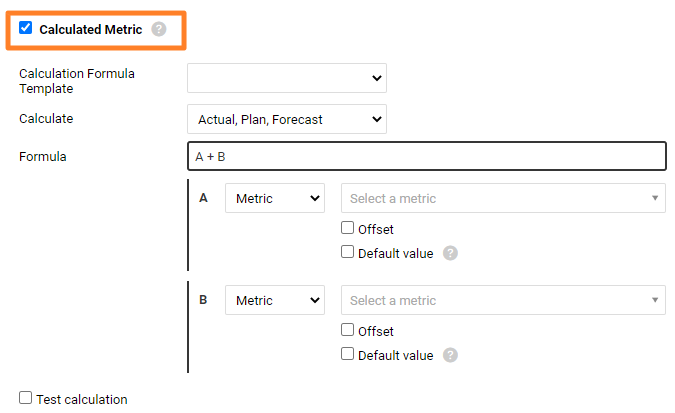
The last option in the metric’s advanced settings is Calculated metric.
- See the list of available functions in Calculated Metrics & Advanced Formulas.
- You can also read Metrics driven by other metrics – Calculated metrics.
Video guide: How to create a new metric
Related video guides: Enable Unit Conversion, Metric’s Definition & Related documents
请先查看指标的基本设置,然后按照以下说明完成指标的可选:高级设置。
描述指标
- 指标全称用于解释指标标题中使用的缩写(例如OTTR – On-Time to Request)。
- 指标的定义可帮助团队了解如何正确测量和报告数据。
- 相关文档将指标链接到提供更多详情的其他文档。
- 指标定义负责人是系统内部用户,您可以就指标定义或其他报告细节与其联系。
设置单元格宽度和累计计算
- 单元格宽度:用于指标仪表板。
- 可将累计(YTD、QTD、MTD、WTD)和全年计算公式字段设为SUM、AVE、最后输入的值,或按公式计算。您可以在全期间计算依据中选择计划值或预测值。
设置图表坐标轴和小数位数
- 图表坐标轴最小值/最大值定义图表Y轴上显示的数值范围。低于最小值和高于最大值的数值会被隐藏。
- 默认小数位数是使用该指标的指标仪表板中显示的小数位数。
- 如何将周分配到月:选择您的偏好。
设置累计汇总
设置累计汇总功能后,每日或每周的数值会自动汇总为月度数值。从子菜单中选择计算方式(求和、平均值等),并选择日历类型。
自然月累计汇总只能用于每日或每月数据。如果按周收集数据,则必须按照财务日历(4-4-5或5-4-4)汇总月度数值。
如果您的公司不使用财务日历,请选择自然月选项,并手动输入每周和每月数据,不使用系统计算。季度和年度数值会自动计算。系统无法根据周数据计算自然月数值,因为一周可能跨两个月。
设为计算指标
指标高级设置中的最后一个选项是计算指标。
- 可用函数列表请参阅计算指标和高级公式。
- 您还可以阅读由其他指标驱动的指标:计算指标。
视频教程:如何创建新指标
还需要帮助吗?
请给我们留言。工作日我们通常会在一小时内回复。