新的仪表板设置
本文由英文机器翻译。 当前显示英文原文。
We have recently upgraded our metric dashboard settings. You can now track and report data not only for organization units, projects, partners and object groups, but also for users, actions, products and product families.
These newly added data collection objects can also be preset in an object group, so it is easy to upload the same group of objects into several metric dashboards. See the details below.
Watch the video guide, or follow the text instructions below.
Settings tabs
Find the settings tabs
The edit mode of metric dashboards is organized into these tabs: Basic Settings, Dashboard Setup, Access & Location, Related Documents, Subscriptions, Notifications and History.

Learn what each tab contains
- Basic Settings: the first tab contains all the basic settings, such as the interval, view options, row layout etc.
- Dashboard Setup: the data collection objects and metrics in a matrix view. The main enhancement was made here, so all the details are described below.
- Access & Location: lock the data for the public (all system users with access to all documents and data in the specific org. structure unit) and keep it accessible only to invited users (specific TeamGuru users). You can also enable the Protect Settings function and select the system users who are the only ones allowed to edit the dashboard’s settings. To share the dashboard with an external partner, use the External Sharing field and select the partner. An important part of each metric dashboard is the Document Location: the org. structure unit where the dashboard is located.
- Related Documents: link related documents for easy navigation.
- Subscriptions: send the dashboard to mailboxes on a predefined schedule.
- Notifications: set up Data Entry Reminder, Send Overdue Notification or Send RCCA Reminder.
- History: view the history log of changes to the dashboard settings.
Set up data collection objects
Add objects
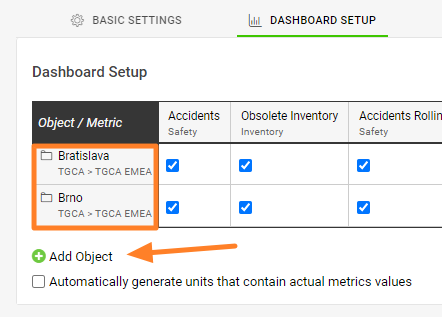
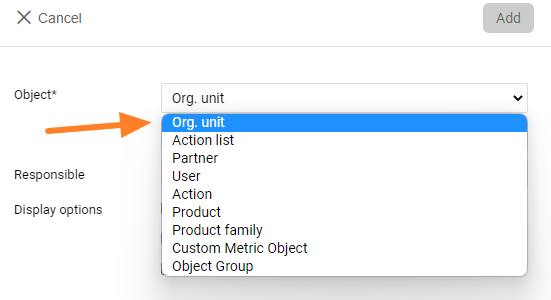
On the Dashboard Setup tab, click Add Object. You can select specific objects or their combinations (objects = org. units, action lists, partners, users, actions, products, product families), or a predefined group of objects using an object group.
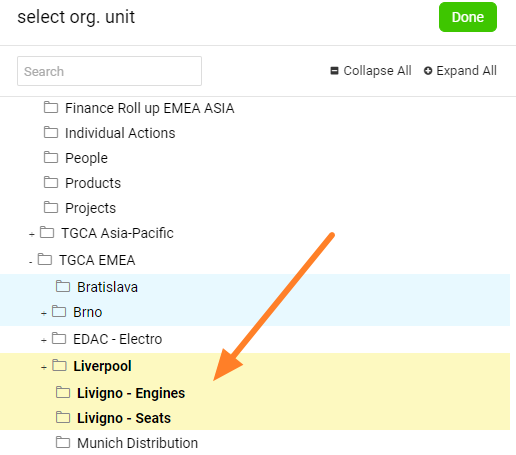
You can also multi-select org. units from the structure: click your org. structure and select as many units as you need in one step.
Choose the object type
The data collection objects can be:
Multi-select org. units
Select all the org. units you need by clicking them.
Add a responsible to all selected units
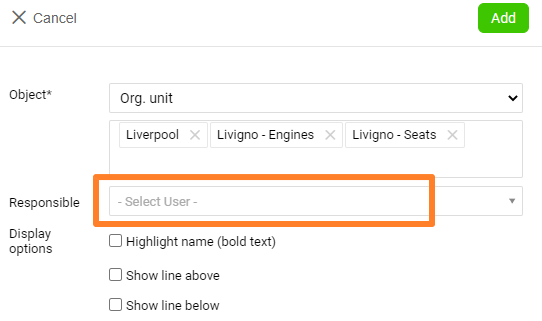
You can add a responsible person (from the list of users) to all the selected org. units on the dashboard at once, when you select the org. units.
Add a responsible per org. unit
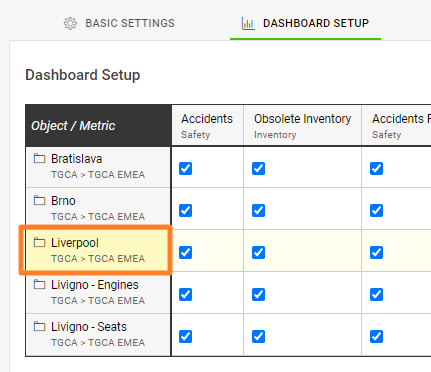
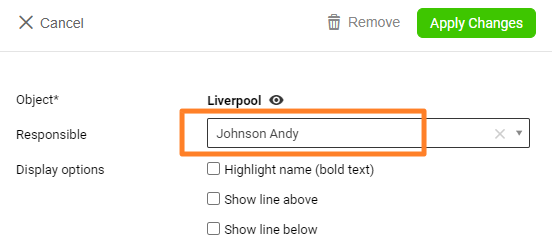
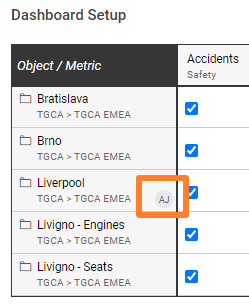
Alternatively, add a responsible to each org. unit separately by clicking the org. unit.
Set up metrics
Add a metric
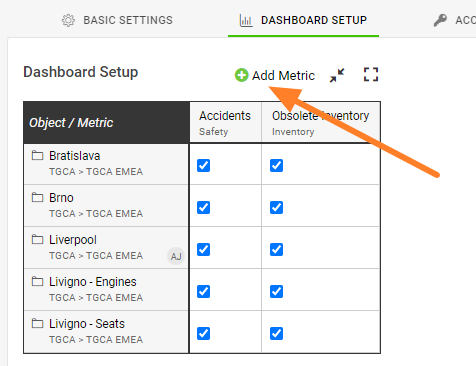
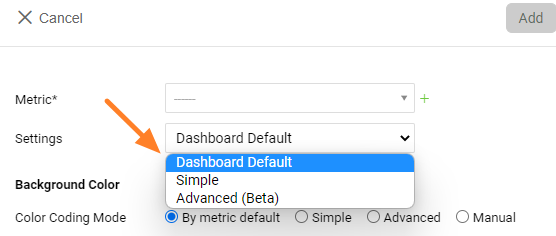
Click Add metric, select from the existing metrics and choose the other settings.
Choose the metric settings
- Dashboard Default applies all the settings from the dashboard’s basic settings.
- Simple provides some basic options, such as showing to-date or full-period values, showing a summary row, hiding values (displaying a red, yellow or green smiley icon) etc.
- Advanced (Beta) provides advanced settings, advanced columns, raw values and calculations from an original metric.
Create a new metric from the dashboard
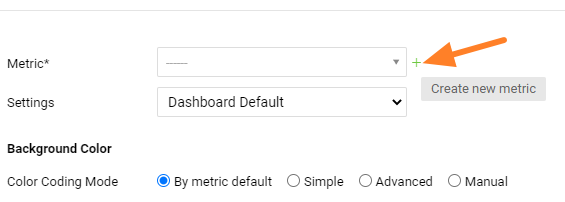
You can also create completely new metrics directly from your dashboard.
Add a responsible per org. unit and metric
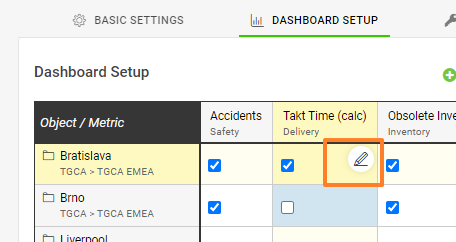
You can add a responsible person for an org. unit and metric combination by clicking the edit pencil at the intersection of the org. unit and the metric.
Move org. units and metrics
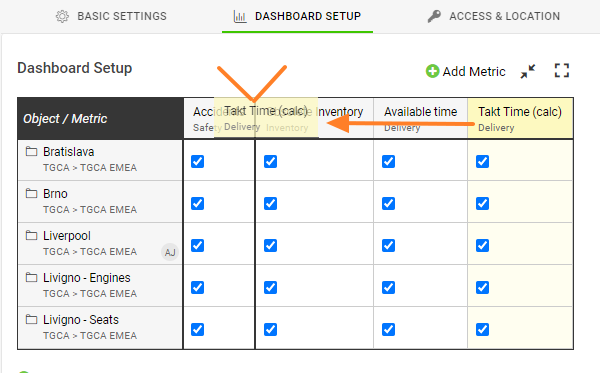
To move an org. unit or a metric, simply drag and drop it.
Use the right-click menu
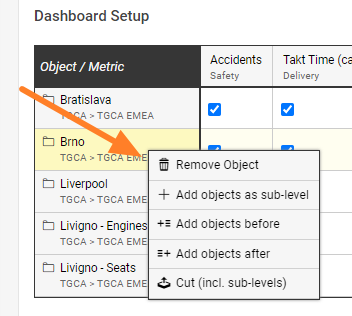
You can also right-click your org. unit or metric to remove the metric, or to add or copy it to a specific place in your dashboard.
Activate or deactivate combinations
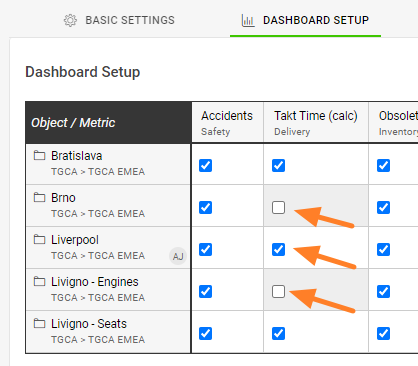
To select which metrics are displayed in the dashboard, tick (activate) or untick (deactivate) the org. unit and metric combination.
Save the settings
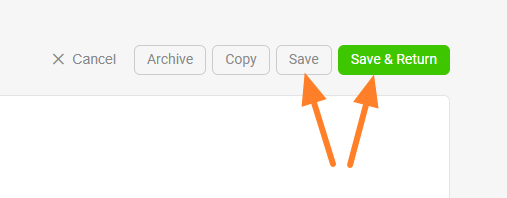
And please, don’t forget to save your settings.
Related articles: Custom Objects and Summary metrics
我们近期升级了指标仪表板设置。现在,您不仅可以为组织单元、项目、合作伙伴和对象组跟踪和报告数据,还可以为用户、行动、产品和产品系列跟踪和报告数据。
这些新增的数据收集对象也可以预设在对象组中,便于将同一组对象加载到多个指标仪表板中。详情见下文。
观看视频教程,或按照下方的文字说明操作。
设置选项卡
找到设置选项卡
指标仪表板的编辑模式包含以下选项卡:基本设置、仪表板设置、访问权限和位置、相关文档、订阅、通知和历史记录。
了解各选项卡的内容
- 基本设置:第一个选项卡包含所有基本设置,例如区间、视图选项、行布局等。
- 仪表板设置:以矩阵视图显示数据收集对象和指标。主要改进就在这里,详情见下文。
- 访问权限和位置:对公众(有权访问特定组织结构单元中所有文档和数据的所有系统用户)锁定数据,仅允许受邀用户(特定的TeamGuru用户)访问。您还可以启用保护设置功能,并选择唯一有权编辑仪表板设置的系统用户。要与外部合作伙伴共享仪表板,请使用外部共享字段并选择合作伙伴。每个指标仪表板的一个重要部分是文档位置:即仪表板所在的组织结构单元。
- 相关文档:链接相关文档,便于导航。
- 订阅:按预定的时间表将仪表板发送到邮箱。
- 通知:设置数据录入提醒、发送逾期通知或发送RCCA提醒。
- 历史记录:查看仪表板设置的更改历史记录。
设置数据收集对象
添加对象
在仪表板设置选项卡中,点击添加对象。您可以选择特定对象或其组合(对象=组织单元、行动清单、合作伙伴、用户、行动、产品、产品系列),也可以通过对象组选择预定义的一组对象。
您还可以从组织结构中多选组织单元:点击组织结构,一步选择所需的任意数量单元。
选择对象类型
数据收集对象可以是:
多选组织单元
点击选择所需的全部组织单元。
为所有所选单元添加负责人
选择组织单元时,您可以一次性为仪表板中所有所选组织单元添加负责人(从用户列表中选择)。
为每个组织单元添加负责人
也可以点击组织单元,分别为每个组织单元添加负责人。
设置指标
添加指标
点击添加指标,从现有指标中选择,并选择其他设置。
选择指标设置
- 仪表板默认:应用仪表板基本设置中的所有设置。
- 简单:提供一些基本选项,例如显示累计值或全期间值、显示汇总行、隐藏数值(显示红色、黄色或绿色笑脸图标)等。
- 高级(Beta):提供高级设置、高级列、原始值以及基于原始指标的计算。
从仪表板创建新指标
您也可以直接从仪表板创建全新的指标。
为每个组织单元和指标添加负责人
点击组织单元与指标交叉处的编辑铅笔图标,即可为该组织单元与指标组合添加负责人。
移动组织单元和指标
要移动组织单元或指标,只需拖放即可。
使用右键菜单
您还可以右键单击组织单元或指标,删除指标,或将其添加或复制到仪表板中的特定位置。
启用或停用组合
要选择仪表板中显示哪些指标,请勾选(启用)或取消勾选(停用)组织单元与指标的组合。
保存设置
最后,请别忘了保存设置。
还需要帮助吗?
请给我们留言。工作日我们通常会在一小时内回复。